Fig. 6.
Download original image
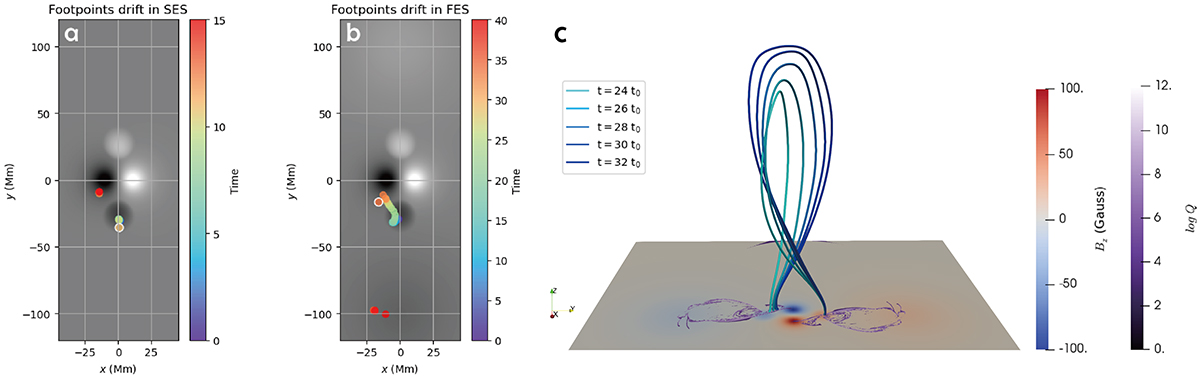
Footpoint drift in the SES case and FES case. Panel (a) presents the negative footpoints of the axis in SES, where the white circle locates the footpoint position at t = 11 t0. Panel (b) is similar to (a), but in FES, and the white circle locates the footpoint position at t = 34 t0. In both panels, rainbow colors represent different simulation times. Panel (c) shows the axis morphology evolution from t = 24 t0 to t = 32 t0 in FES, and the purple contour shows the QSL at the bottom at t = 24 t0.
Current usage metrics show cumulative count of Article Views (full-text article views including HTML views, PDF and ePub downloads, according to the available data) and Abstracts Views on Vision4Press platform.
Data correspond to usage on the plateform after 2015. The current usage metrics is available 48-96 hours after online publication and is updated daily on week days.
Initial download of the metrics may take a while.