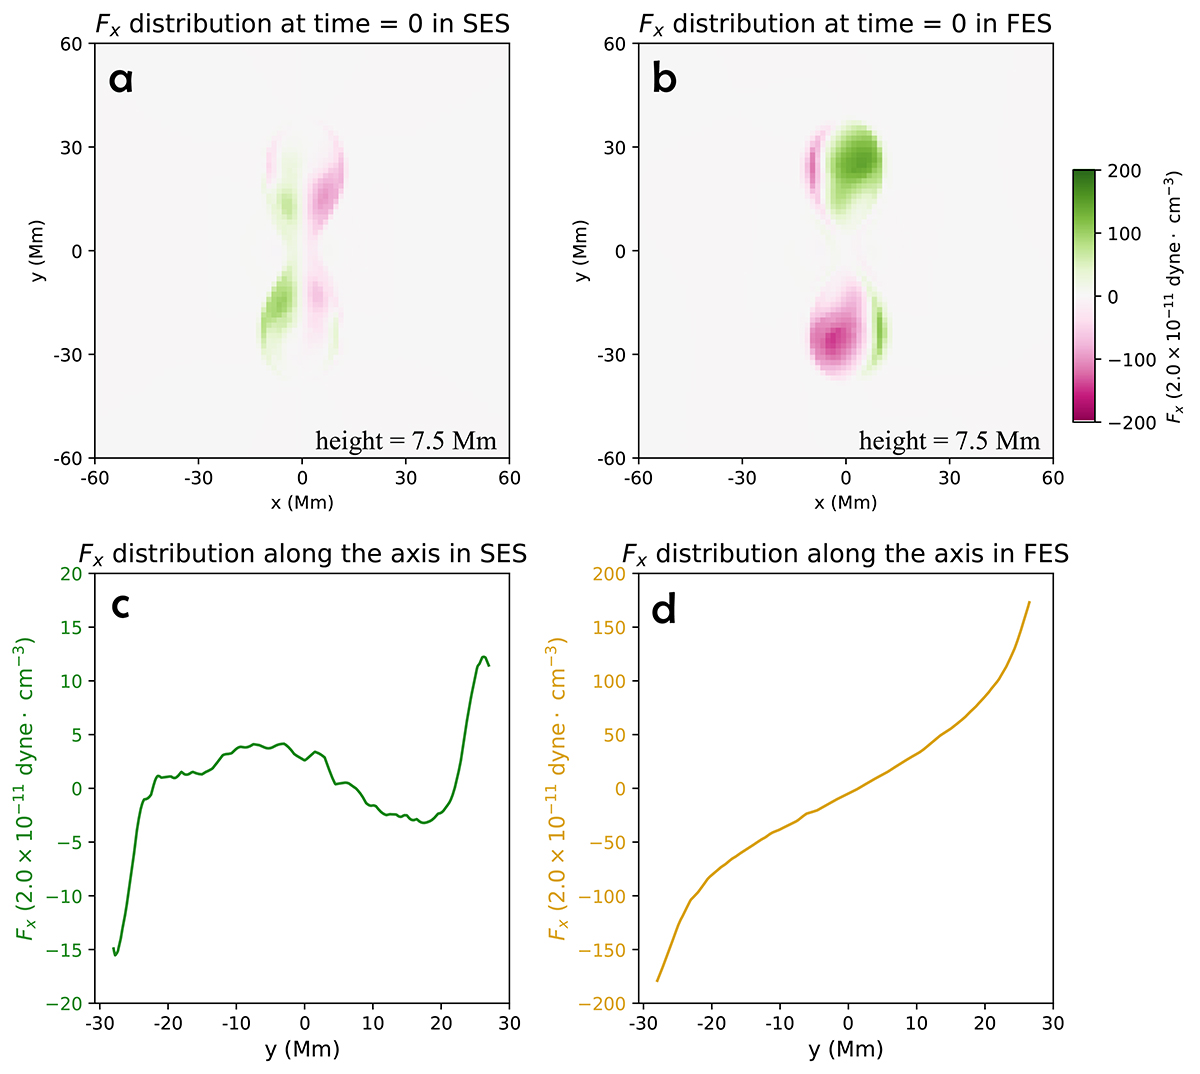
Fig. 5.
Download original image
Distribution of the horizontal Lorentz force at t = 0. Panel (a) shows the Fx distribution in horizontal slices z = 7.5 Mm in SES, in which Fx along x+ (x−) is plotted in green (plum). (c) Fx along the axis at t = 0 in SES, where the abscissa represents the y value of the sample point on the axis. Panels (b) and (d) are similar to panels (a) and (c), respectively, but for the FES case. Panels (a) and (b) focus on the center part of the simulation with (−60, 60) Mm in the x range and (−60, 60) Mm in the y range.
Current usage metrics show cumulative count of Article Views (full-text article views including HTML views, PDF and ePub downloads, according to the available data) and Abstracts Views on Vision4Press platform.
Data correspond to usage on the plateform after 2015. The current usage metrics is available 48-96 hours after online publication and is updated daily on week days.
Initial download of the metrics may take a while.