Fig. 3.
Download original image
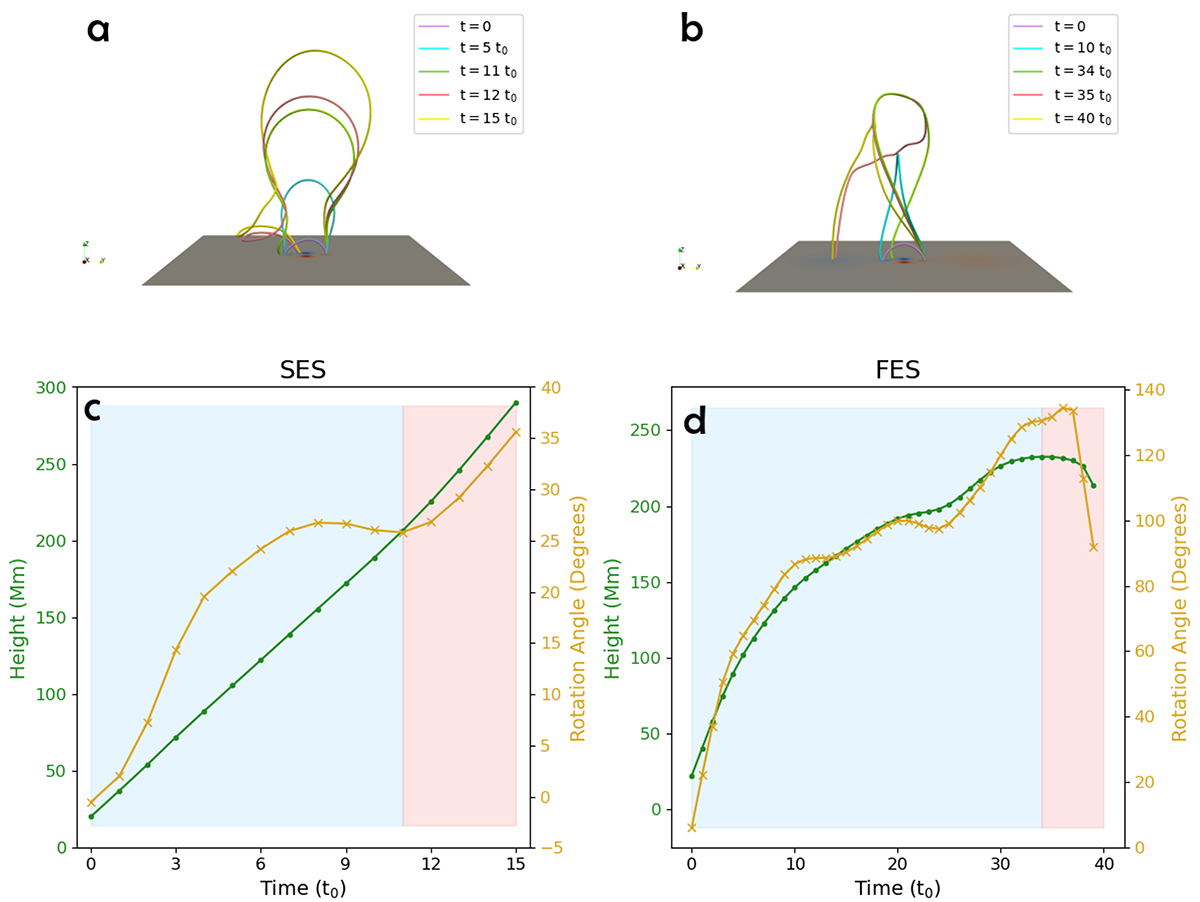
Kinematics evolution of the SES case and FES case. Panels (a) and (b) show several field lines originating from the center of the positive footpoint at (0, 28, 0) Mm in SES and FES. Panels (c) and (d) present the evolution of the flux-rope height (green lines with dots) and rotation angle (yellow lines with crosses) by measuring the height and tangential angle at the apex of the field lines in SES and FES.
Current usage metrics show cumulative count of Article Views (full-text article views including HTML views, PDF and ePub downloads, according to the available data) and Abstracts Views on Vision4Press platform.
Data correspond to usage on the plateform after 2015. The current usage metrics is available 48-96 hours after online publication and is updated daily on week days.
Initial download of the metrics may take a while.