Fig. A.1
Download original image
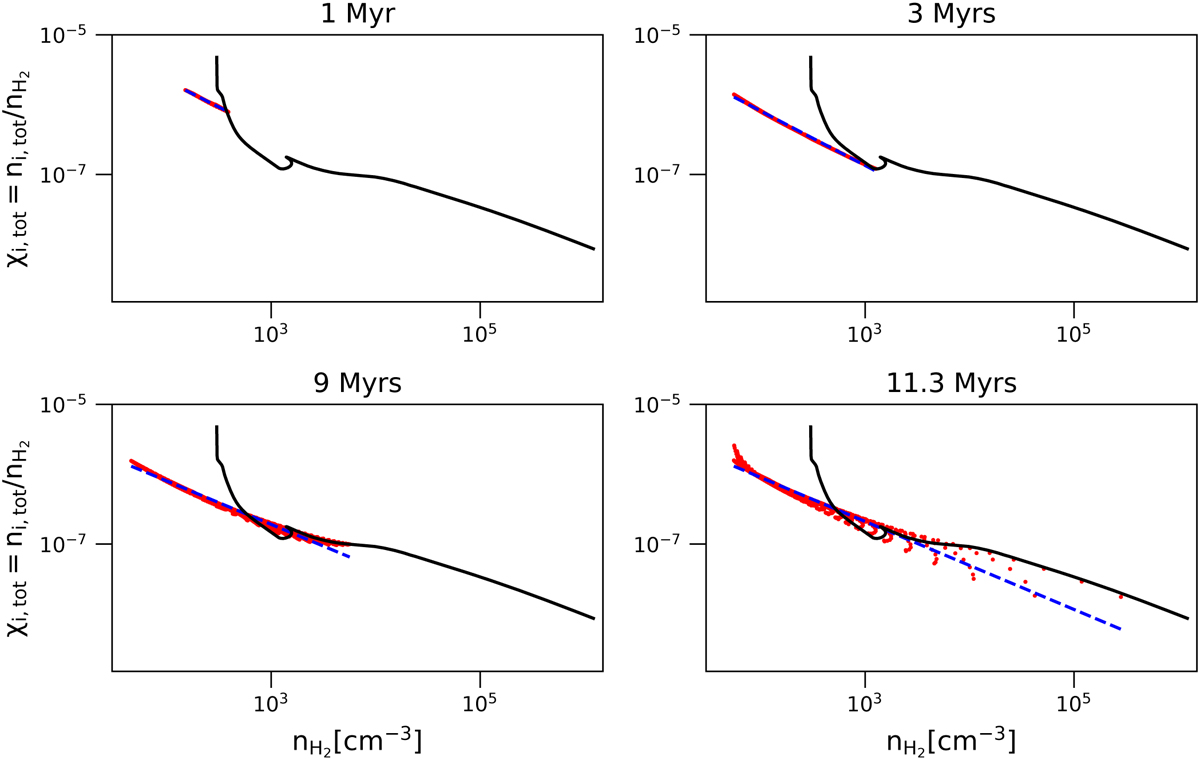
Evolution of the ion abundance as a function of the H2 number density for the fiducial model at times of, from top right to bottom left, 1 Myr, 3 Myrs, 9 Myrs, and 11.3 Myrs. The black line represents the abundance-density relation at the center of the cloud for the entire duration of the simulation, the red points correspond to the ionization fraction from all cells in the domain at the specific point in time, and the blue dashed lines represent the power law that best fits the abundance-density relation at that point in time.
Current usage metrics show cumulative count of Article Views (full-text article views including HTML views, PDF and ePub downloads, according to the available data) and Abstracts Views on Vision4Press platform.
Data correspond to usage on the plateform after 2015. The current usage metrics is available 48-96 hours after online publication and is updated daily on week days.
Initial download of the metrics may take a while.