Fig. 6
Download original image
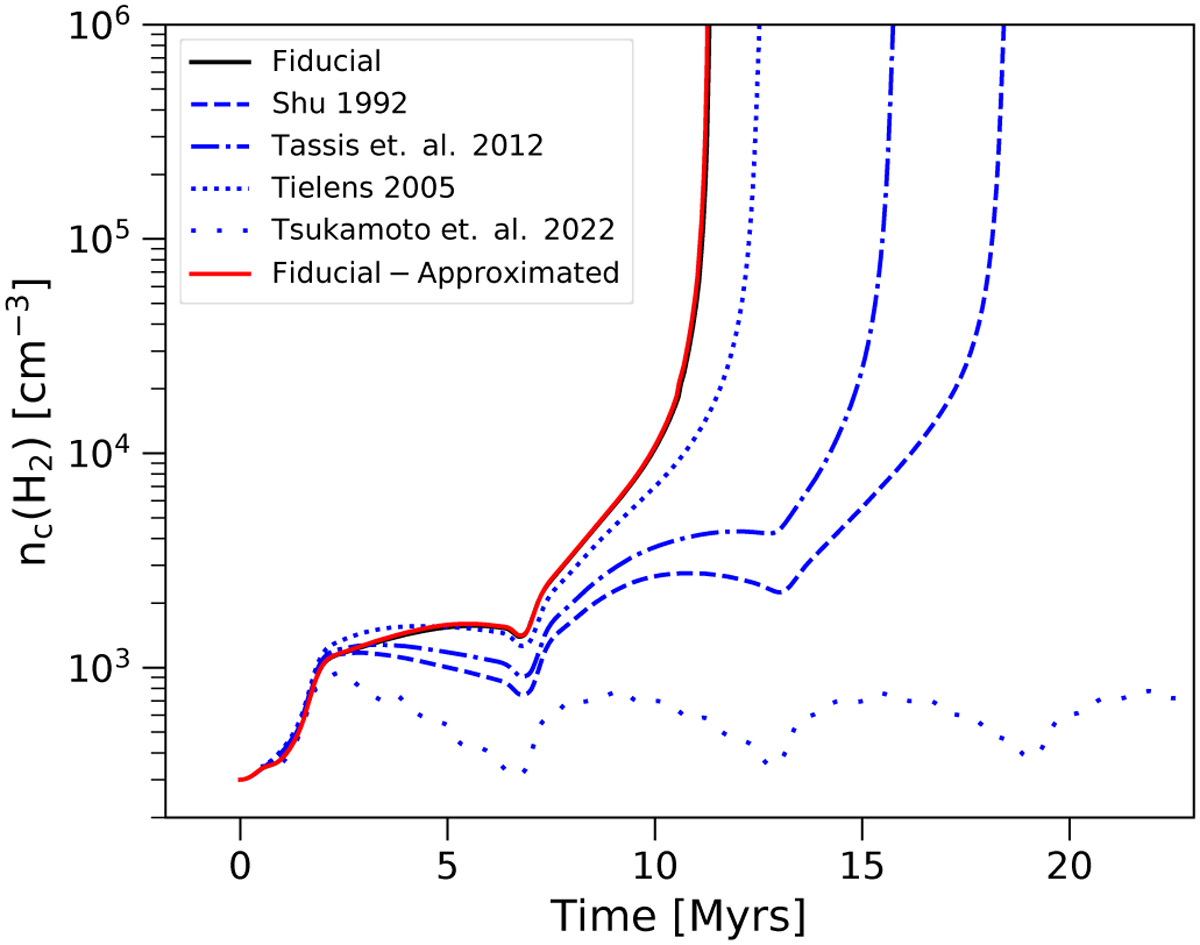
Central H2 number density evolution in simulations with identical initial conditions (fiducial model; see Table 1) but using different methods for calculating the resistivities. The black line represents a simulation using a full chemical network, the red line represents a simulation using the method described in this paper, and the blue lines represent methods proposed in the literature.
Current usage metrics show cumulative count of Article Views (full-text article views including HTML views, PDF and ePub downloads, according to the available data) and Abstracts Views on Vision4Press platform.
Data correspond to usage on the plateform after 2015. The current usage metrics is available 48-96 hours after online publication and is updated daily on week days.
Initial download of the metrics may take a while.