Fig. 4
Download original image
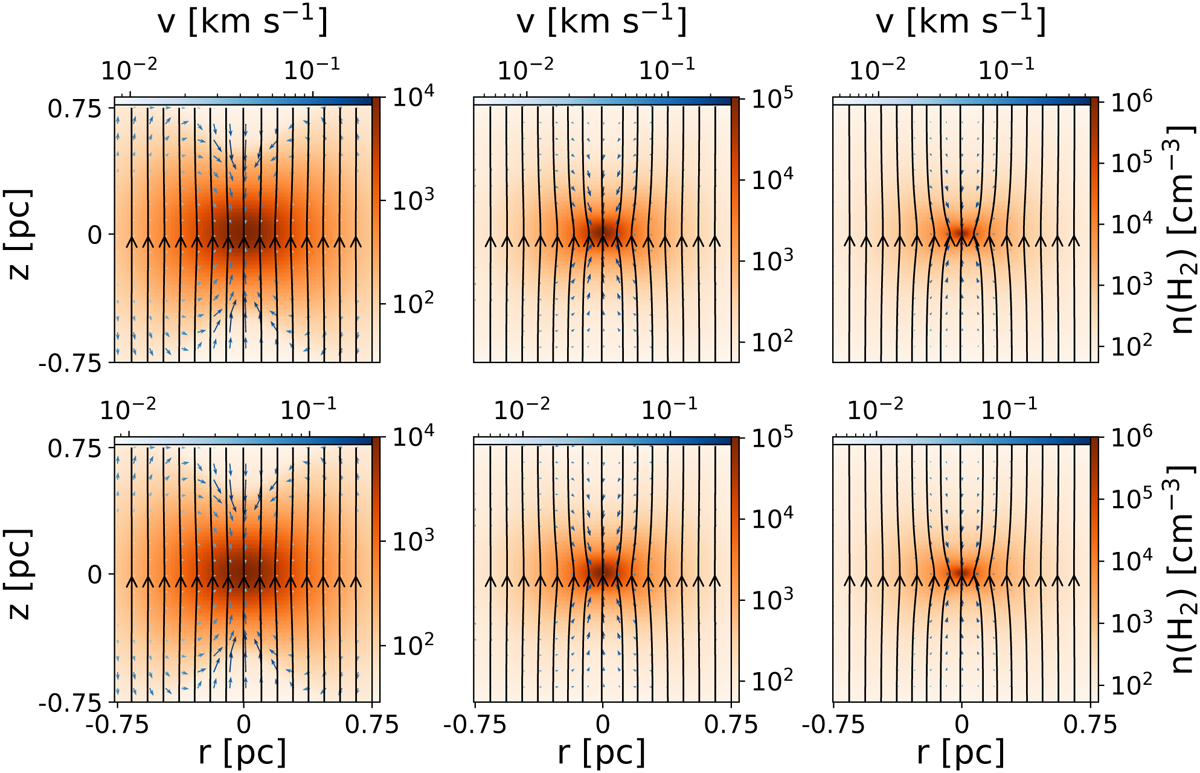
Comparison of the spatial distribution of the density between a simulation where the resistivities are calculated using our non-equilibrium chemical network (top row) and a simulation where the resistivities are computed using our approximation (bottom row) for our fiducial model. We compare our results for three different central number densities of 104 (left column), 105 (middle column), and 106 cm−3 (right column). The black arrows represent the magnetic field, and the blue arrows represent the velocity of the plasma.
Current usage metrics show cumulative count of Article Views (full-text article views including HTML views, PDF and ePub downloads, according to the available data) and Abstracts Views on Vision4Press platform.
Data correspond to usage on the plateform after 2015. The current usage metrics is available 48-96 hours after online publication and is updated daily on week days.
Initial download of the metrics may take a while.