Fig. 8
Download original image
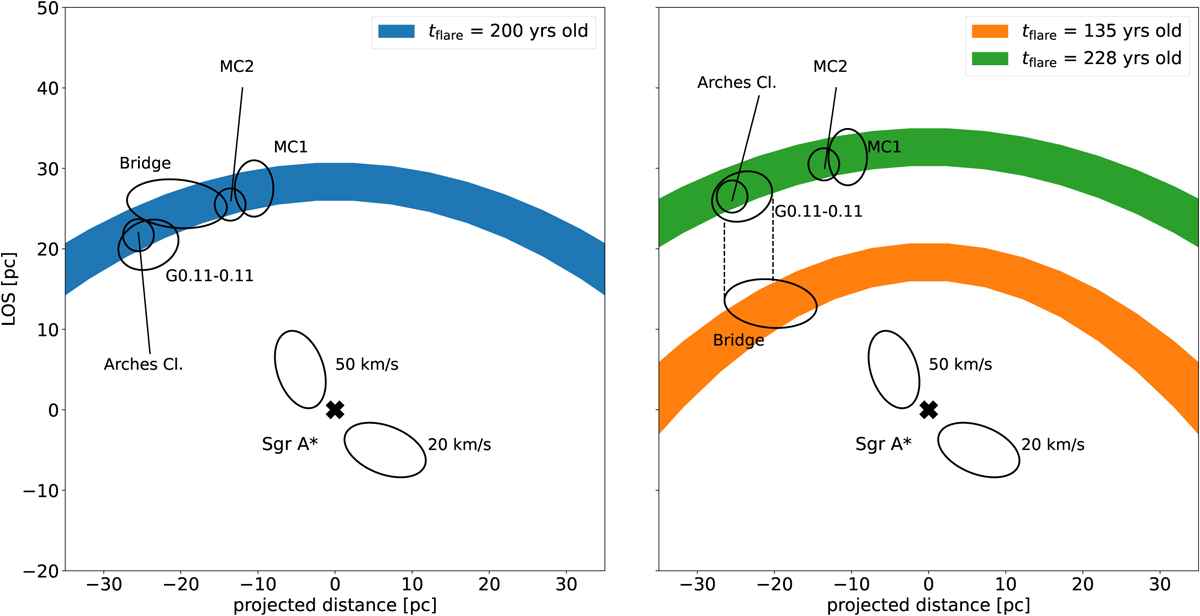
Top view of the molecular clouds in the Sgr A complex. Left panel: single flare scenario. The Sgr A complex appears as a compact structure located ≃25 pc behind Sgr A⋆. The width of the parabola refers to the space sampled by the wavefront in the past 30 years, rather than the duration of the flare. Right panel: multiple flares scenario described in Clavel et al. (2013) and Chuard et al. (2018). The Sgr A complex is illuminated by a short flare (happened ≃135 years ago) and a longer flare (≃228 years ago). Two dashed lines highlight the connection between the Bridge and G0.11-0.11.
Current usage metrics show cumulative count of Article Views (full-text article views including HTML views, PDF and ePub downloads, according to the available data) and Abstracts Views on Vision4Press platform.
Data correspond to usage on the plateform after 2015. The current usage metrics is available 48-96 hours after online publication and is updated daily on week days.
Initial download of the metrics may take a while.