Fig. 7
Download original image
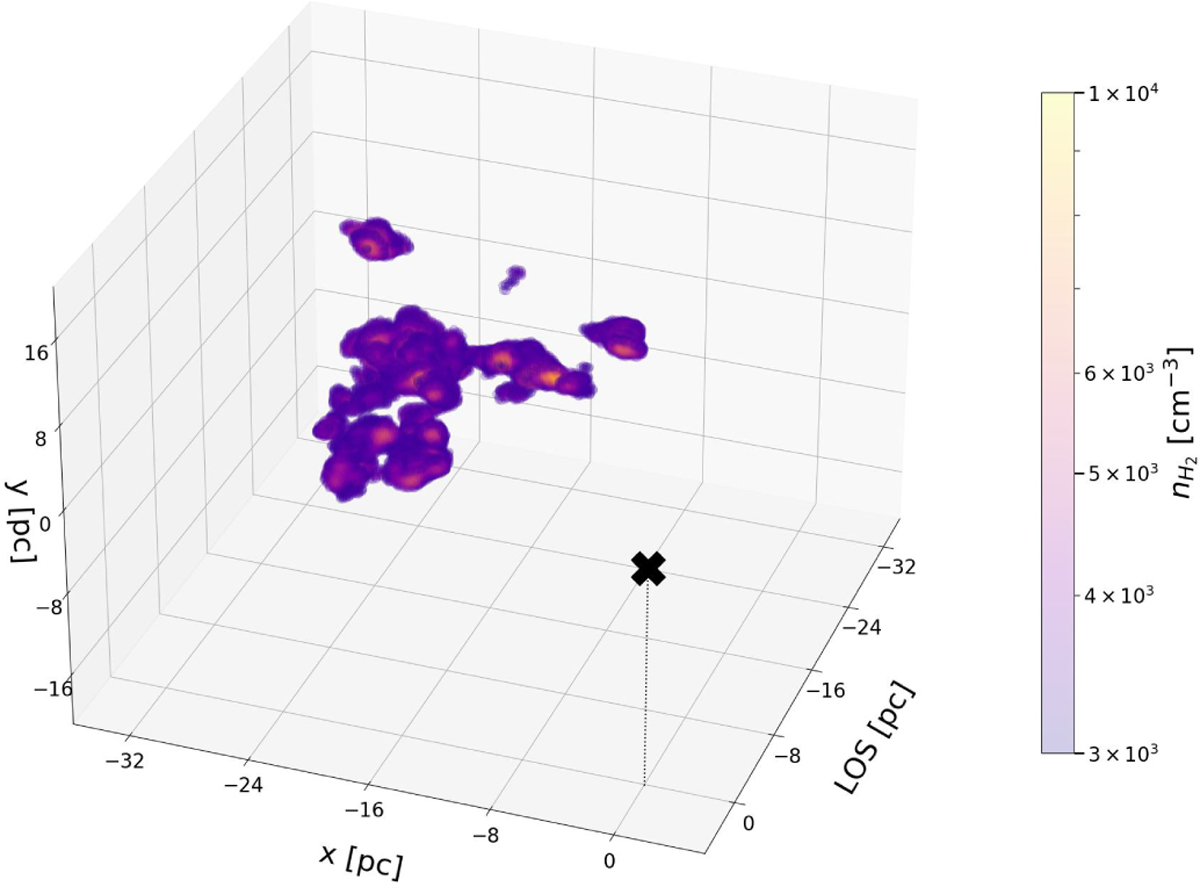
Spatial distribution of molecular clouds in the Sgr A complex assuming they are illuminated by a 200-year-old flare from Sgr A⋆. Sgr A⋆ is located in (0,0,0), a vertical dotted line is plotted to make its position at the axis origin clearer. y-axis points toward positive Galactic latitude; x-axis points toward negative Galactic longitude. Negative values along the LOS are behind Sgr A⋆.
Current usage metrics show cumulative count of Article Views (full-text article views including HTML views, PDF and ePub downloads, according to the available data) and Abstracts Views on Vision4Press platform.
Data correspond to usage on the plateform after 2015. The current usage metrics is available 48-96 hours after online publication and is updated daily on week days.
Initial download of the metrics may take a while.