Open Access
Fig. 4
Download original image
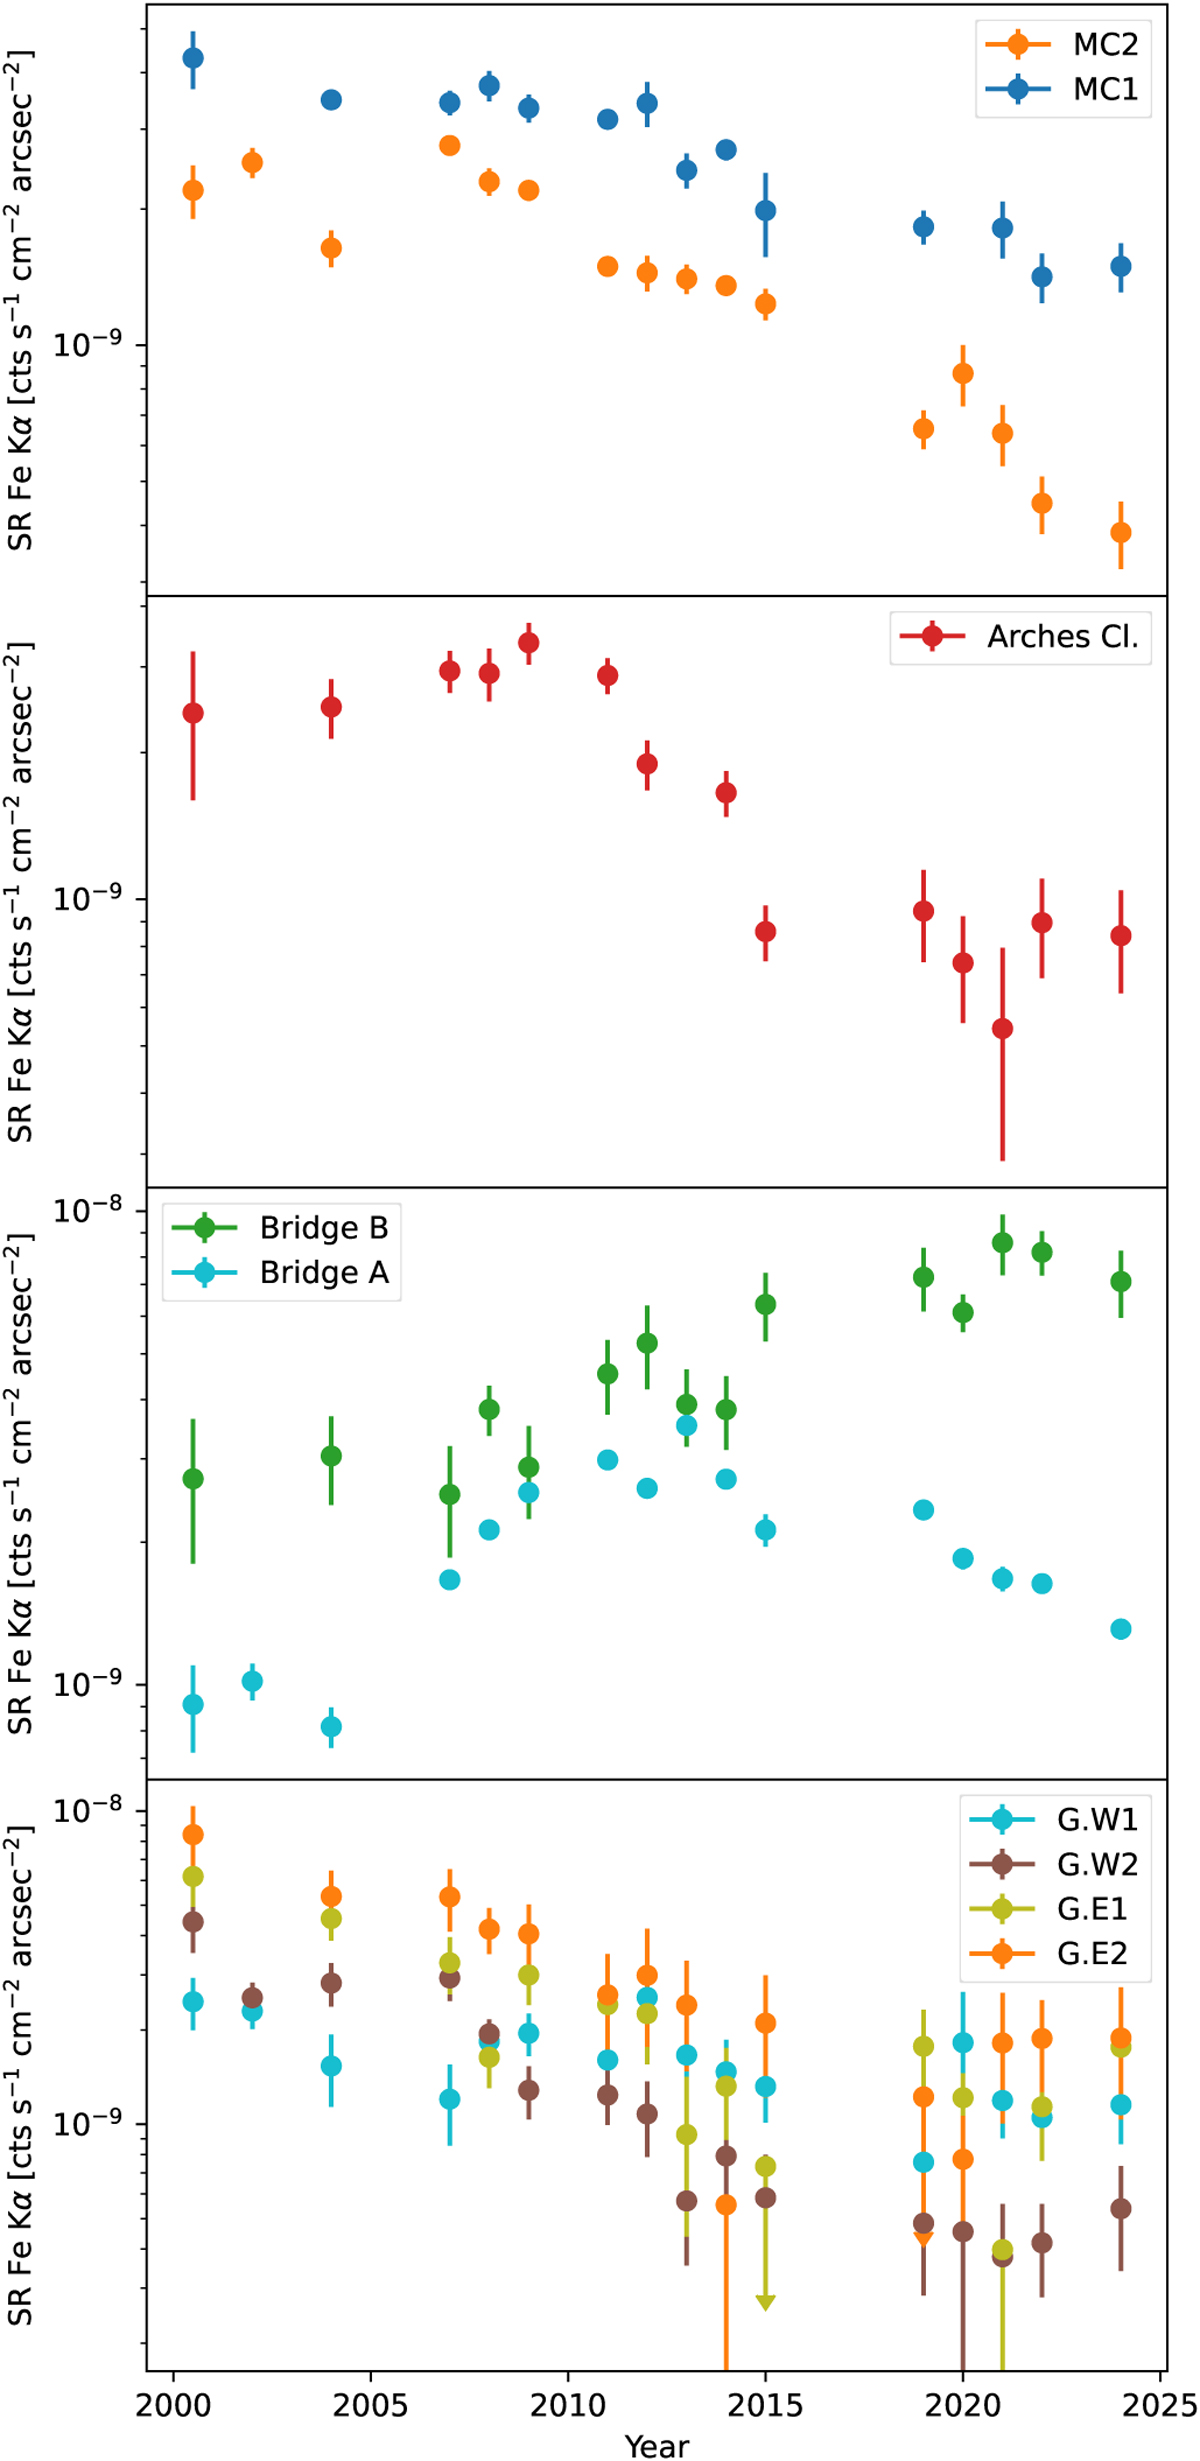
Fe Kα surface rate obtained from spectral fitting of selected regions inside the Sgr A complex as a function of the year of observation. The integrated flux is divided by the solid angle over which the spectrum is accumulated. Error bars refer to 1 σ uncertainty.
Current usage metrics show cumulative count of Article Views (full-text article views including HTML views, PDF and ePub downloads, according to the available data) and Abstracts Views on Vision4Press platform.
Data correspond to usage on the plateform after 2015. The current usage metrics is available 48-96 hours after online publication and is updated daily on week days.
Initial download of the metrics may take a while.