Open Access
Fig. 3
Download original image
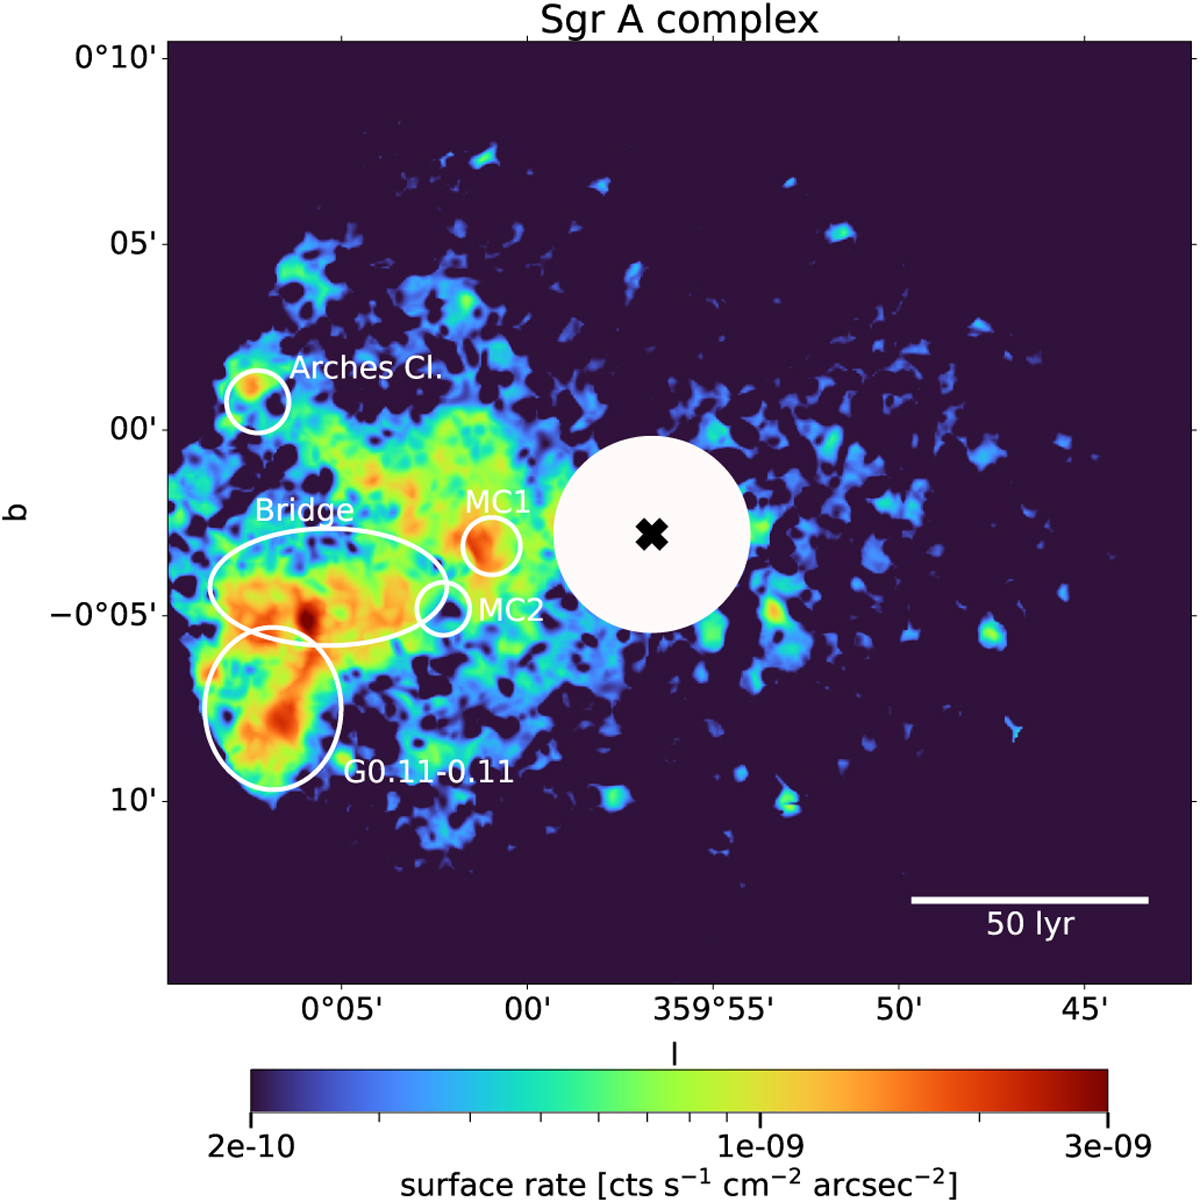
Minimum map of the Fe Kα emission in the period 2000–2024. The map was computed from the maps in Fig. 2; the value in each pixel is the minimum across the 16 epochs considered in this work. The scale bar indicating the 50 lyr measure across the sky was computed at the Galactic center distance.
Current usage metrics show cumulative count of Article Views (full-text article views including HTML views, PDF and ePub downloads, according to the available data) and Abstracts Views on Vision4Press platform.
Data correspond to usage on the plateform after 2015. The current usage metrics is available 48-96 hours after online publication and is updated daily on week days.
Initial download of the metrics may take a while.