Fig. 2
Download original image
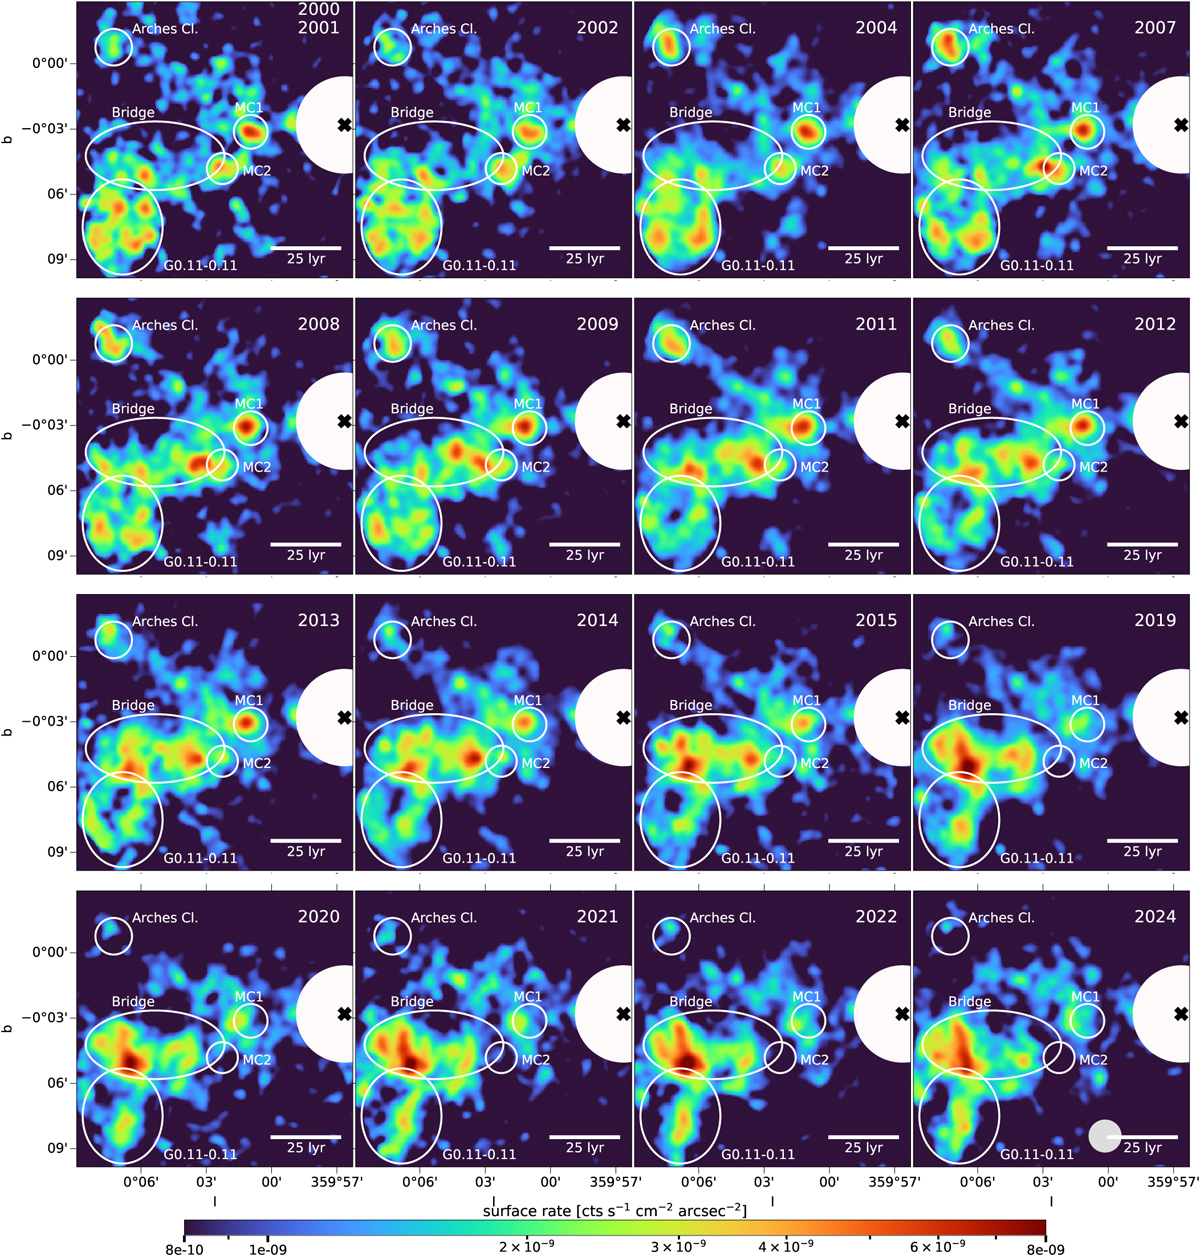
Fe Kα emission for different years. The images were created by selecting events in the [6.1; 6.6] keV energy range. For each image, a background was computed in the [4.5; 6.0] keV band and subtracted. The black cross marks the position of Sgr A⋆, while a recently observed low-luminosity transient (Reynolds et al. 2024) is masked during 2024 observation (gray circle). The position of the main molecular clouds is highlighted by ellipses.
Current usage metrics show cumulative count of Article Views (full-text article views including HTML views, PDF and ePub downloads, according to the available data) and Abstracts Views on Vision4Press platform.
Data correspond to usage on the plateform after 2015. The current usage metrics is available 48-96 hours after online publication and is updated daily on week days.
Initial download of the metrics may take a while.