Fig. 14
Download original image
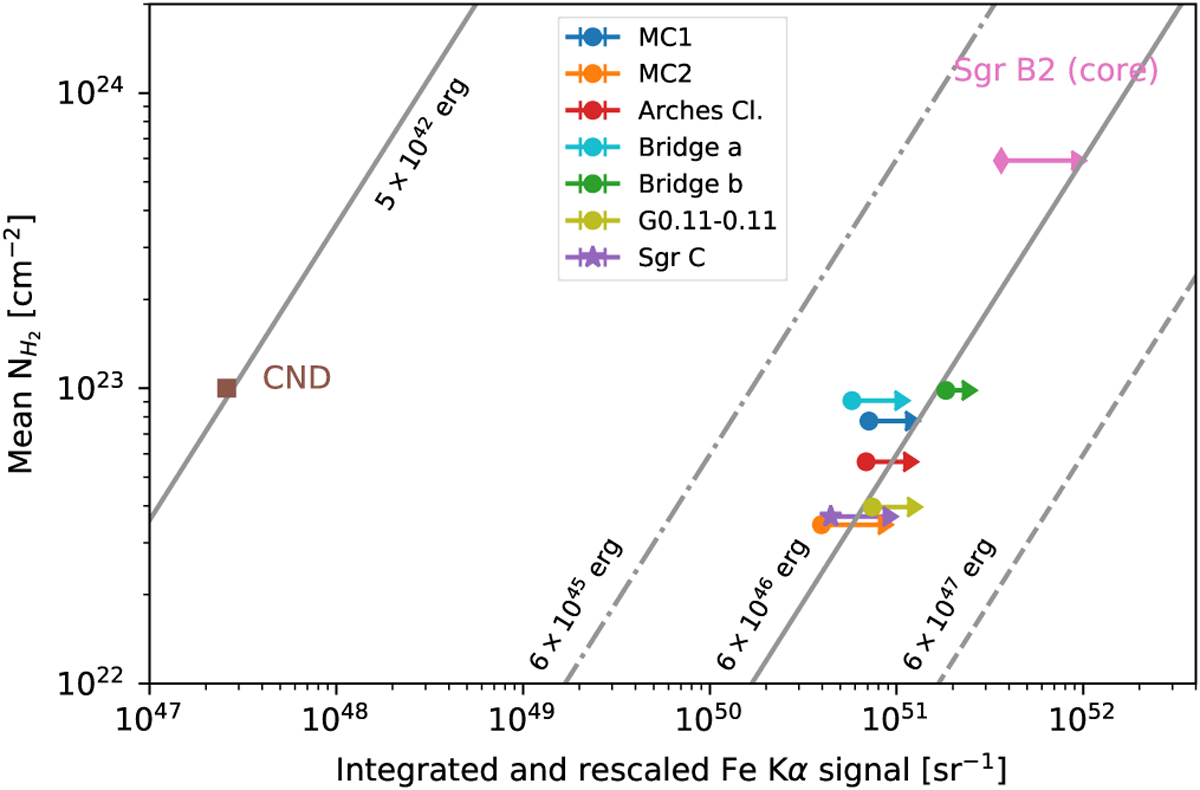
Comparison between the molecular hydrogen column density (![]() ) and the observed Fe Kα signal of the illuminated clouds in the CMZ. The Fe Kα signal represents the time-integrated observed surface rate (i.e., the area under the light curves shown in Fig. 4), rescaled by multiplying it by the square of the physical distance (R2) between the cloud and Sgr A⋆. The lines show the theoretical predictions for different values of total emitted energy in the 2–10 keV band. The
) and the observed Fe Kα signal of the illuminated clouds in the CMZ. The Fe Kα signal represents the time-integrated observed surface rate (i.e., the area under the light curves shown in Fig. 4), rescaled by multiplying it by the square of the physical distance (R2) between the cloud and Sgr A⋆. The lines show the theoretical predictions for different values of total emitted energy in the 2–10 keV band. The ![]() values are derived from the map published by Battersby et al. (2024). Data for Sgr B2 and Sgr C are taken from Terrier et al. (2010, 2018); Chuard et al. (2018). Data for the CND, from Stel et al. (2023), reflect its response to the significantly weaker flare from the magnetar SGR J1745-2900.
values are derived from the map published by Battersby et al. (2024). Data for Sgr B2 and Sgr C are taken from Terrier et al. (2010, 2018); Chuard et al. (2018). Data for the CND, from Stel et al. (2023), reflect its response to the significantly weaker flare from the magnetar SGR J1745-2900.
Current usage metrics show cumulative count of Article Views (full-text article views including HTML views, PDF and ePub downloads, according to the available data) and Abstracts Views on Vision4Press platform.
Data correspond to usage on the plateform after 2015. The current usage metrics is available 48-96 hours after online publication and is updated daily on week days.
Initial download of the metrics may take a while.