Fig. 1
Download original image
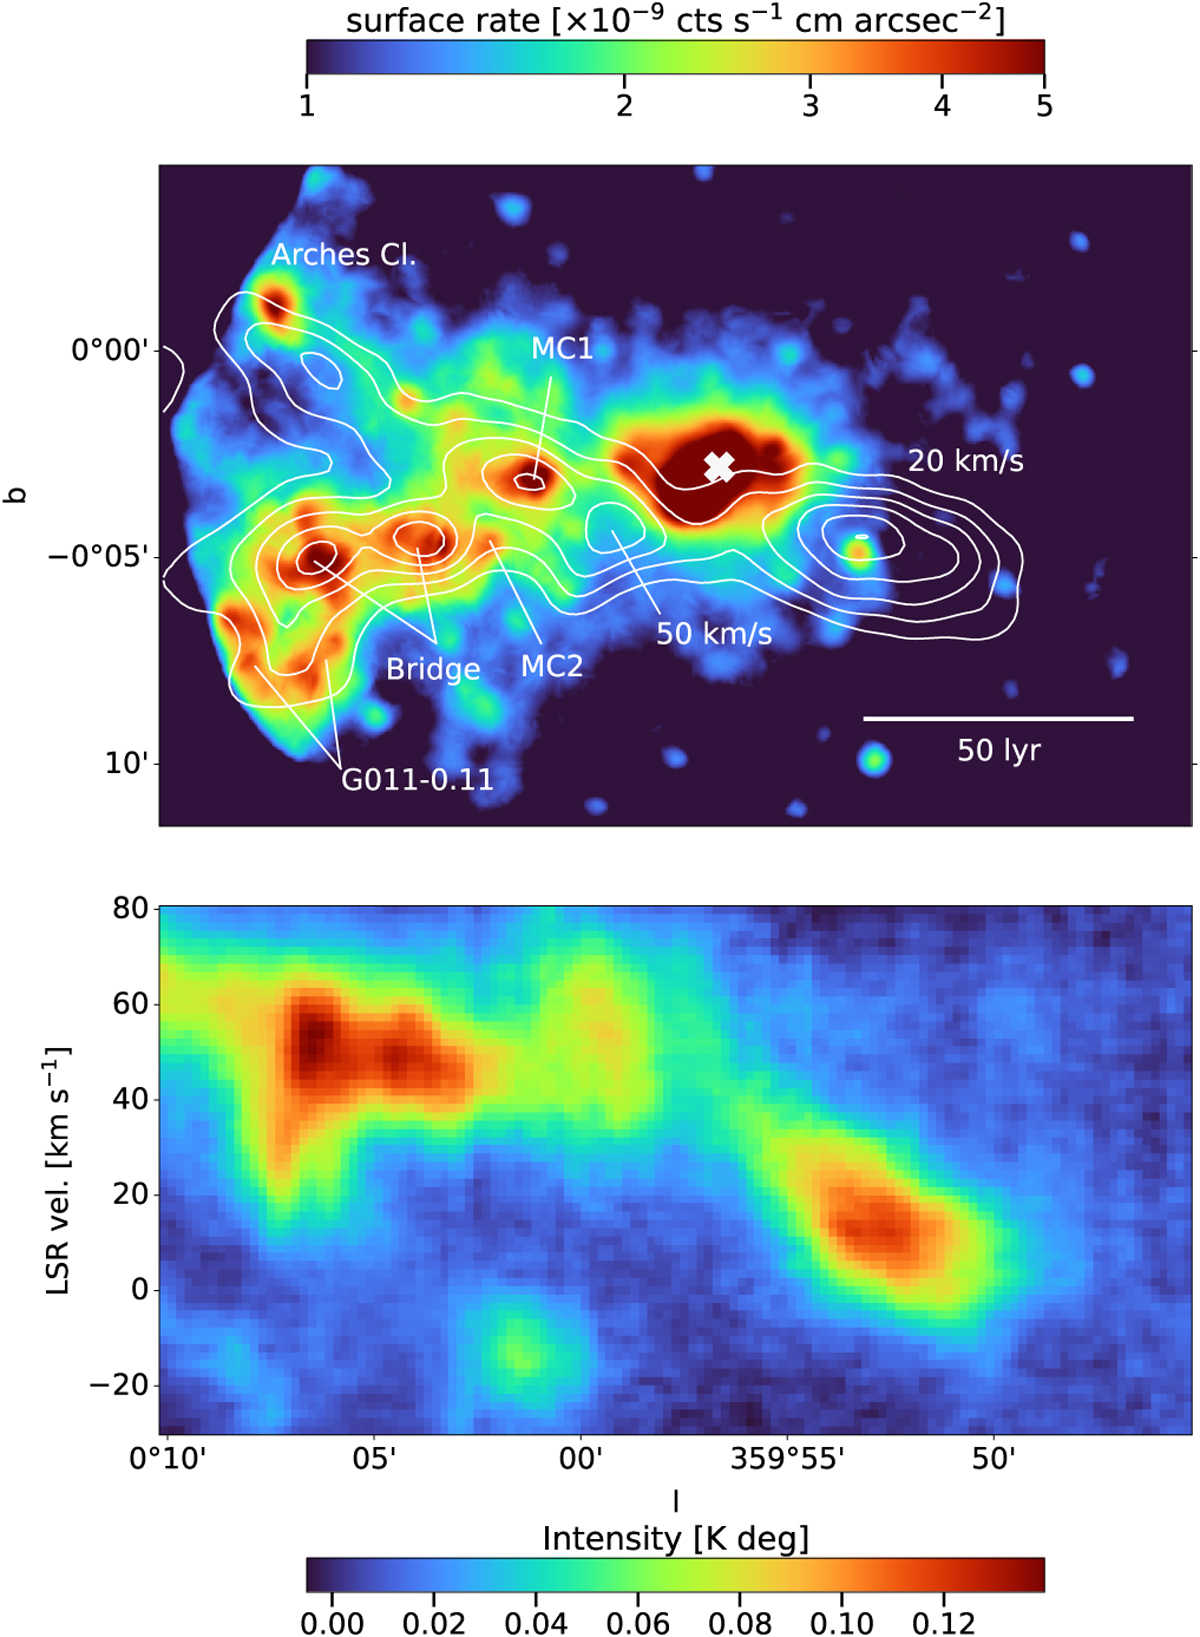
Comparison of Fe Kα emission and molecular line emission. Top panel: median of the Sgr A complex emission in the Fe Kα 6.4 keV line in the period 2000–2024. The white cross marks the position of Sgr A⋆. Contours are computed from the N2H+ line intensity, obtained with the MOPRA telescope, integrated over [−30; 80] km s−1 range of velocities (Jones et al. 2012). Contour lines refer to 20, 30, 40, 50, 60, and 70 K km s−1. The central strong emission, encompassing Sgr A⋆, not associated with molecular clouds, is the supernova remnant Sgr A east (Maeda et al. 2002). Bottom panel: MOPRA longitude–velocity diagram of the same region above. The latitude has been integrated over the [−0.193; 0.169] deg range.
Current usage metrics show cumulative count of Article Views (full-text article views including HTML views, PDF and ePub downloads, according to the available data) and Abstracts Views on Vision4Press platform.
Data correspond to usage on the plateform after 2015. The current usage metrics is available 48-96 hours after online publication and is updated daily on week days.
Initial download of the metrics may take a while.