Fig. 5.
Download original image
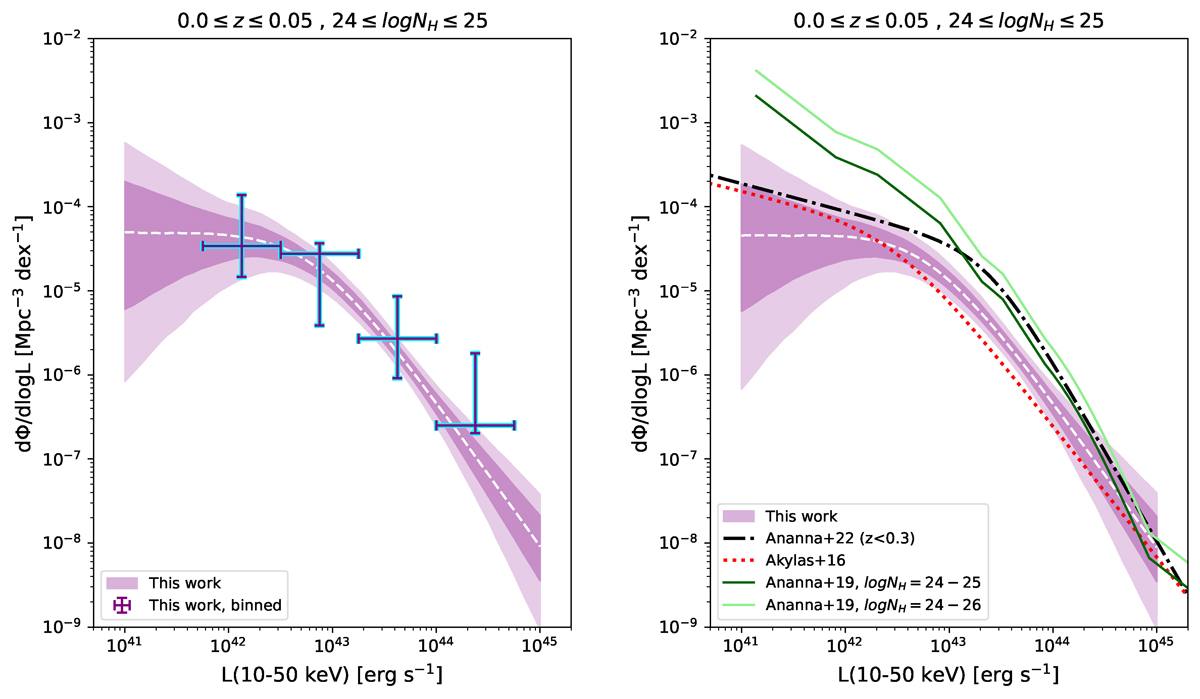
The X-ray luminosity function in the 10–50 keV band. Left panel: Compton-thick (logNH[cm−2] = 24 − 25) X-ray luminosity function in the redshift range 0.0 ≤ z ≤ 0.05. The shaded regions represent the 68% and 95% confidence intervals. The points show the binned 1/Vmax luminosity function with the corresponding 68% uncertainties. Right panel: Our luminosity function compared with those of (Akylas et al. 2016; Ananna et al. 2022) and also by the population synthesis models of Ananna et al. (2019). The best-fitting model of the latter is evaluated at the mean redshift of our analysis (z = 0.025).
Current usage metrics show cumulative count of Article Views (full-text article views including HTML views, PDF and ePub downloads, according to the available data) and Abstracts Views on Vision4Press platform.
Data correspond to usage on the plateform after 2015. The current usage metrics is available 48-96 hours after online publication and is updated daily on week days.
Initial download of the metrics may take a while.