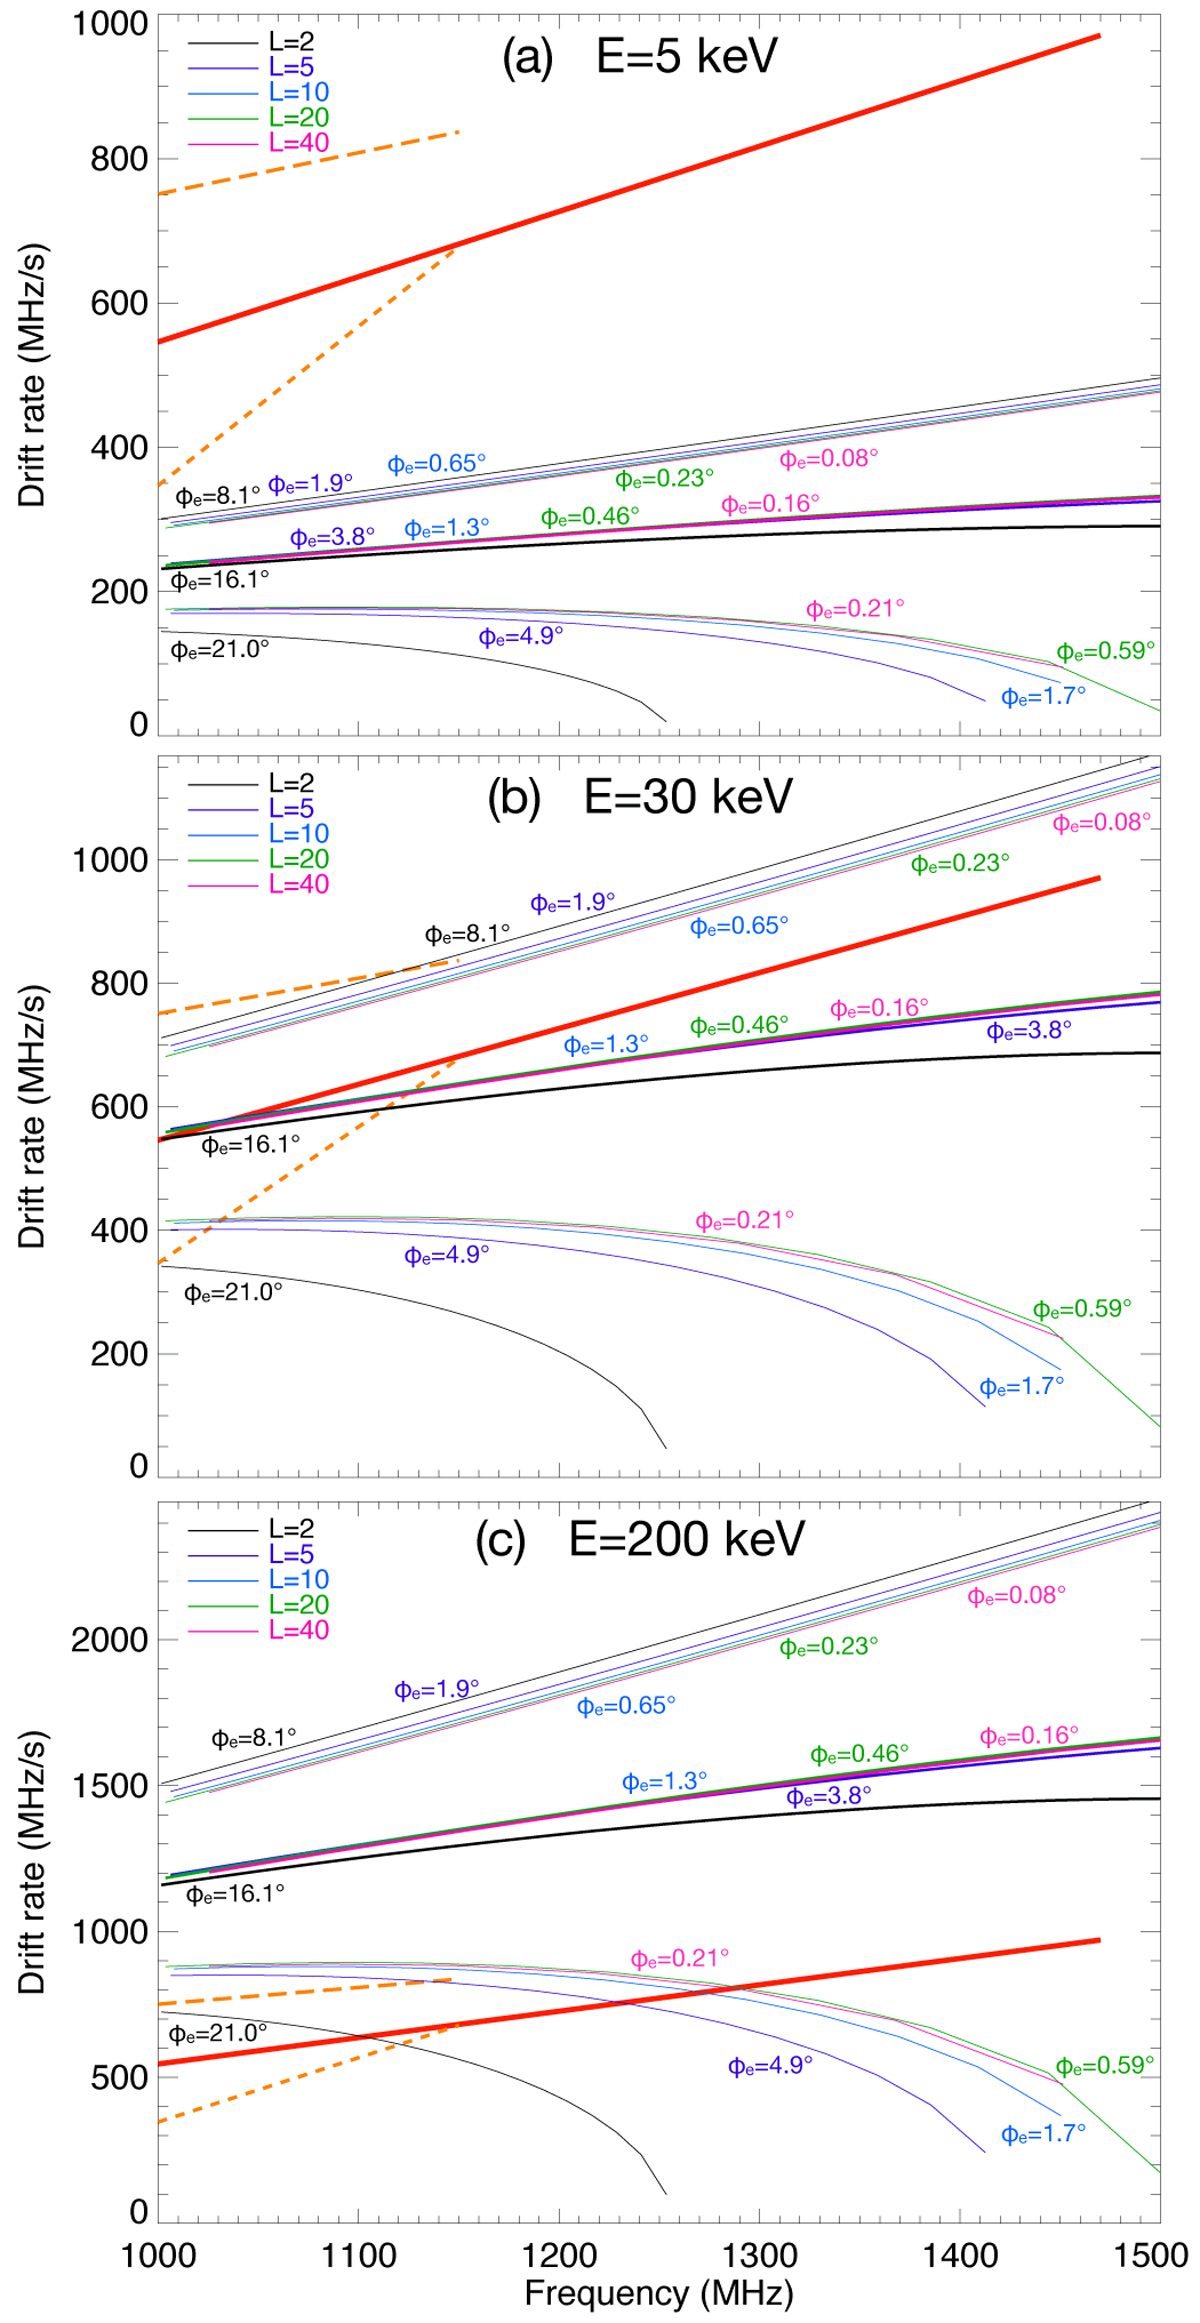
Fig. 6

Download original image
Drift rates calculated in FAST range for electrons with energy 5 keV (a), 30 keV (b), and 200 keV (c). On each panel, drift rates for each L value (same values as in Fig. 5) are plotted in a given color (L=2: black, L=5: violet, L=10: blue, L=20: green, L=40: pink). For each L-shell, drift rates are computed for 3 values of the equatorial pitch angle [ϕe1/2, ϕe1, 1.3 × ϕe1], and the curve corresponding to ϕe = ϕe1 is thicker than the other two. The corresponding value of ϕe is indicated next to each curve in the corresponding color. The red and orange lines represent the drift rates measured by FAST (see text). The increased electron energy corresponds to increased drift rates proportional to the electron velocity across the source regions.
Current usage metrics show cumulative count of Article Views (full-text article views including HTML views, PDF and ePub downloads, according to the available data) and Abstracts Views on Vision4Press platform.
Data correspond to usage on the plateform after 2015. The current usage metrics is available 48-96 hours after online publication and is updated daily on week days.
Initial download of the metrics may take a while.


