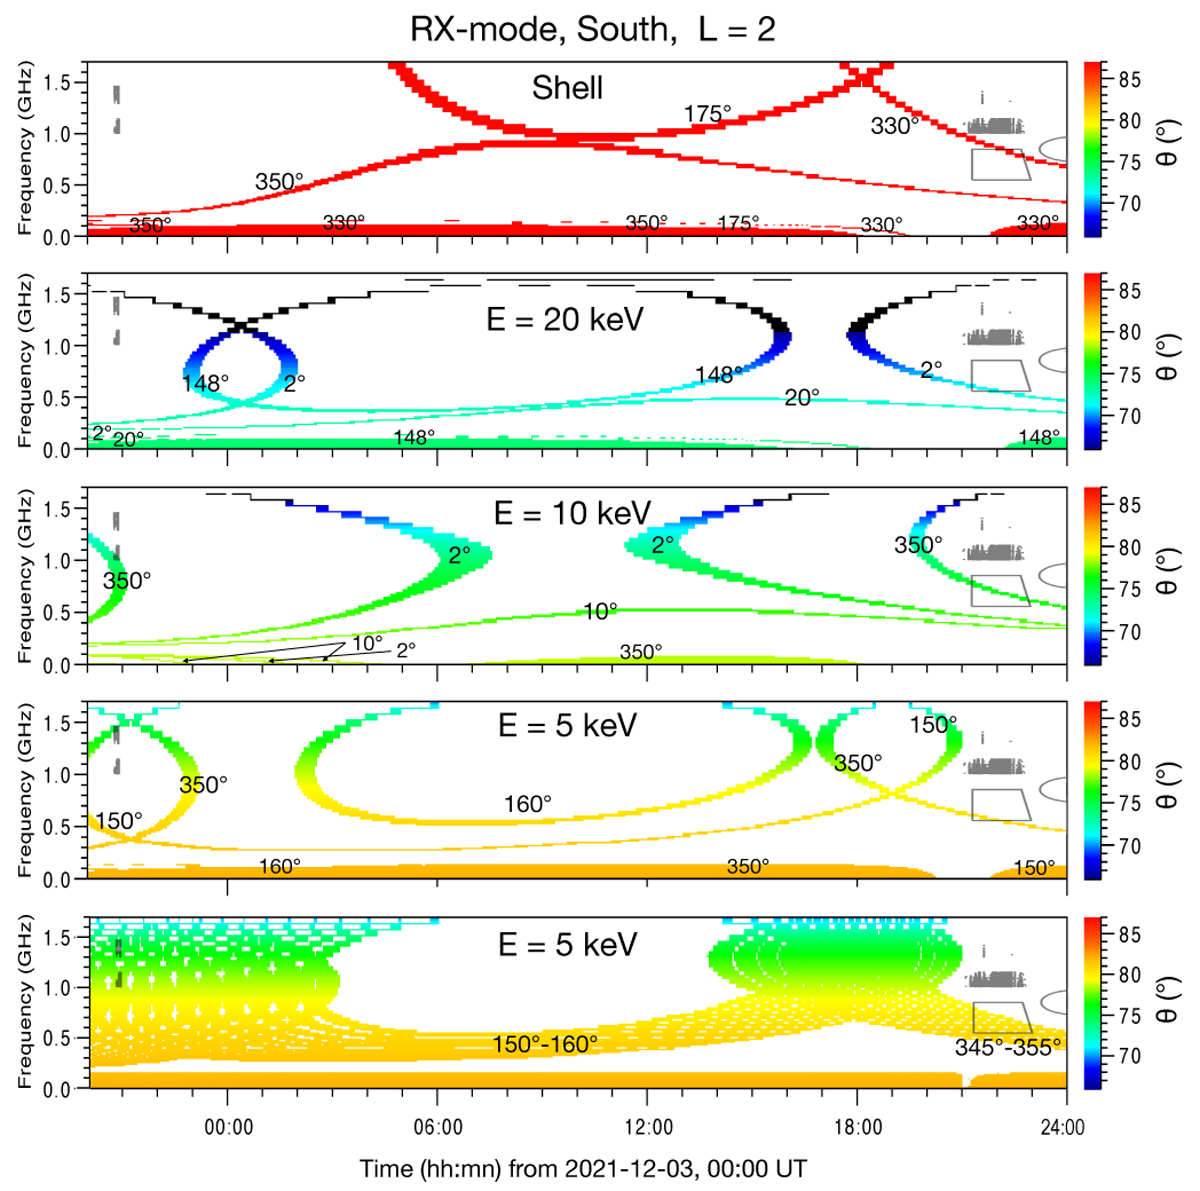
Fig. 4
Download original image
Sample ExPRES simulations of ECM radio emissions from AD Leo between 2 December, 20:00 UT and 3 December, 24:00 UT. Emitting radio sources are placed along AD Leo’s dipolar field lines with magnetic L-shell=2 in the southern hemisphere (in view of the observer), at longitudes indicated on the figure. Emission is produced permanently along each entire field line at the local fce on the R-X mode and beamed in a hollow cone of aperture self-consistently computed by ExPRES (see Appendix B) and of thickness 1°. The upper 4 panels display simulated emissions from a single field line at each indicated longitude. The lower panel displays simulated emissions from two sets of field lines covering each a 10° longitude range with one field line per degree of longitude (the small t–f gaps, that result from this discretisation, disappear with a denser filling, i.e. with more field lines per degree of longitude). Radio arcs are observed across the t–f plane from 0 to 1.7 GHz. Signals observed below ~0.2 GHz result from a mix of emissions produced at various longitudes. Each panel explores one emission scenario for the ECM driver (loss-cone with 5, 10, or 20 keV characteristic energy, or shell in the velocity space). The color scale indicates the beaming angle θ(°) of the emission relative to the local magnetic field vector. Bursts were detected by FAST in the grey-shaded areas, while the grey contours refer to uGMRT detections.
Current usage metrics show cumulative count of Article Views (full-text article views including HTML views, PDF and ePub downloads, according to the available data) and Abstracts Views on Vision4Press platform.
Data correspond to usage on the plateform after 2015. The current usage metrics is available 48-96 hours after online publication and is updated daily on week days.
Initial download of the metrics may take a while.