Fig. B.1
Download original image
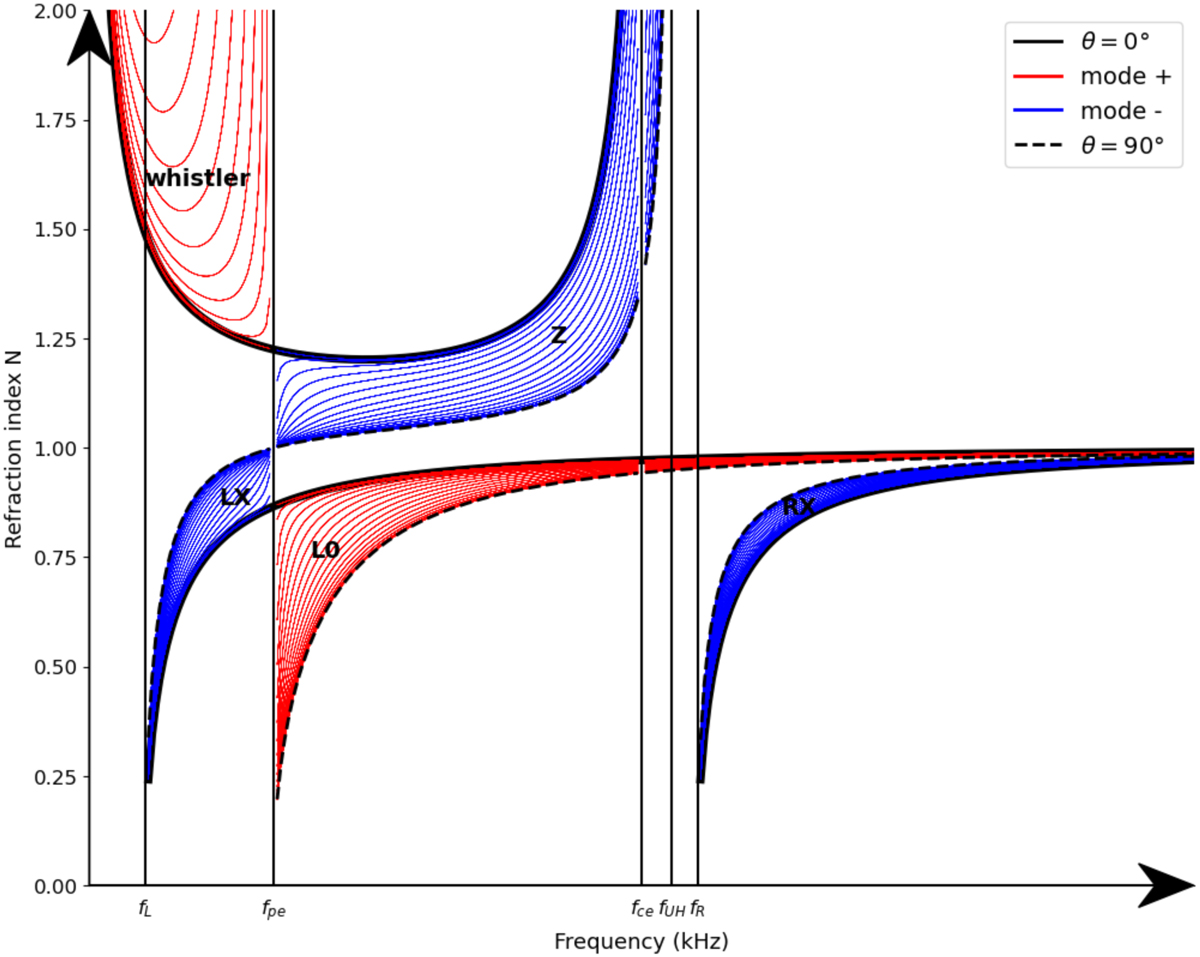
Refractive Index, N, as a function of the frequency f (with ω = 2πf ) for a low-density plasma (i.e., fce > fpe, required for the ECM to occur). The red areas corresponds to the + branch of the Appleton-Hartree expression, while the blue area correspond to the - branch. The oblique propagation dispersion curves for different θ are shown as thin coloured lines (with δθ = 5°), while dispersion curves for parallel propagation (θ = 0°) are shown as thick black lines, and those for perpendicular propagation (θ = 90°) as thick black dashed lines. The frequencies of the L-mode cutoff fL, plasma cutoff fpe , cyclotron resonance fce , upper hybrid resonance fUH and R-mode cutoff fR , are indicated on the x-axis. In this example, fce/ fpe = 0.3. In reality, it is lower than that, but it has been enlarged here for the sake of readability.
Current usage metrics show cumulative count of Article Views (full-text article views including HTML views, PDF and ePub downloads, according to the available data) and Abstracts Views on Vision4Press platform.
Data correspond to usage on the plateform after 2015. The current usage metrics is available 48-96 hours after online publication and is updated daily on week days.
Initial download of the metrics may take a while.