Fig. A.1
Download original image
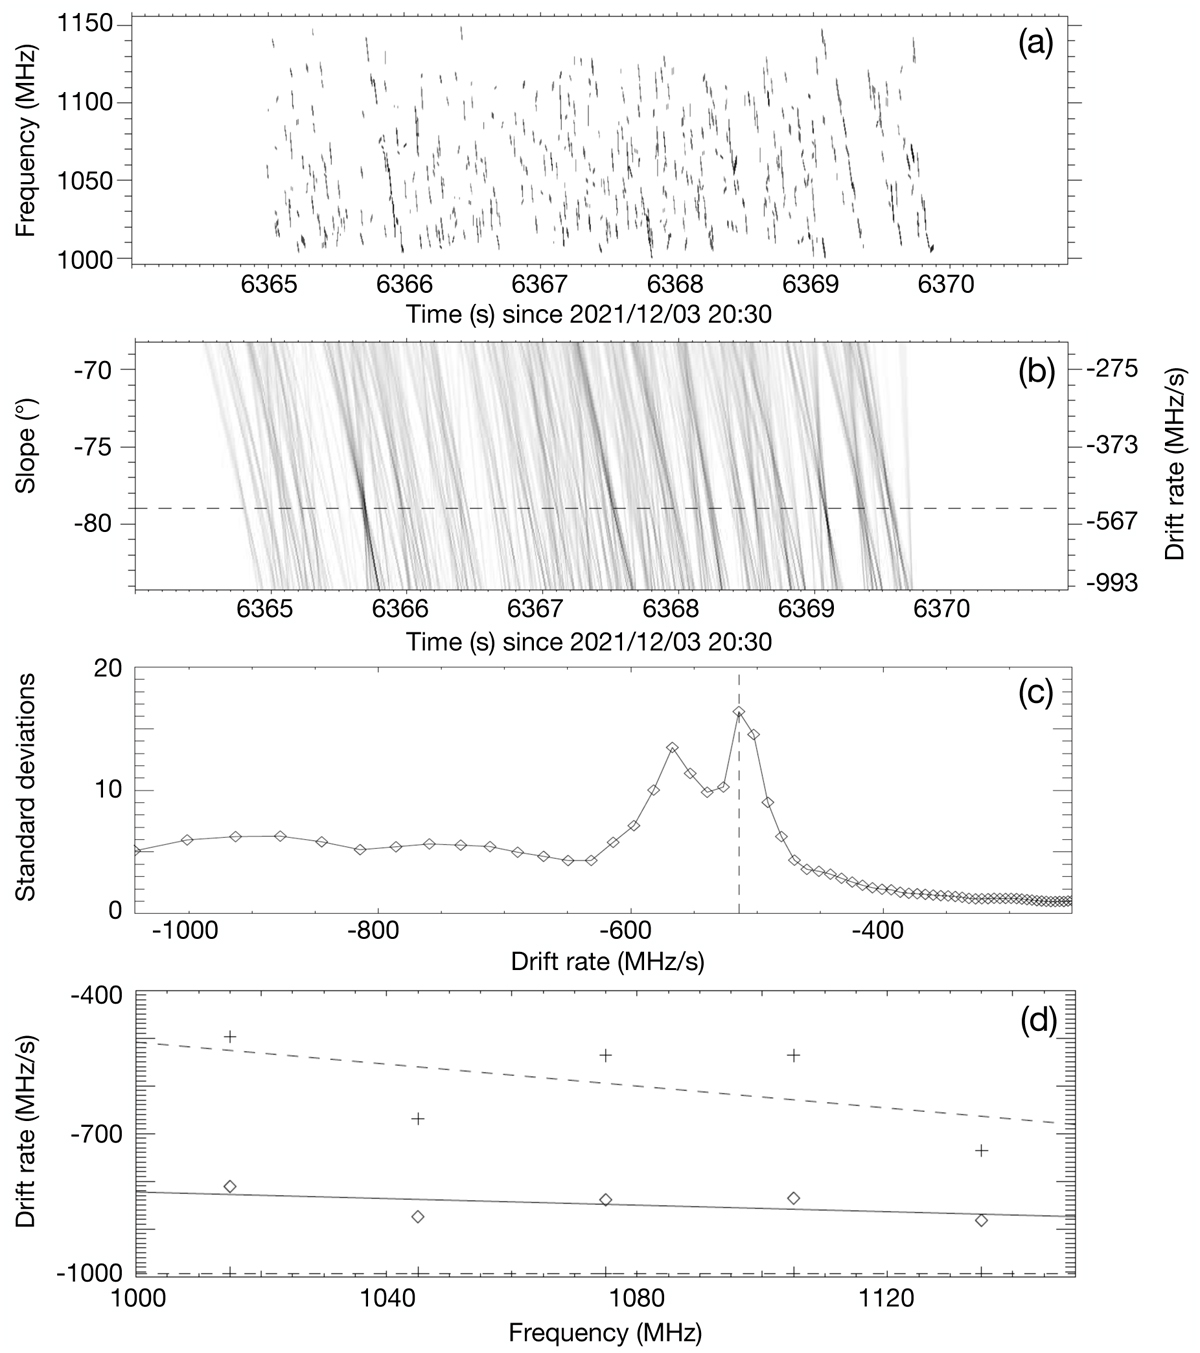
Example of determination of the overall drift rate of sub-burst trains on 3 December 2021. (a) Five seconds of catalogued sub-bursts reproduced from Fig. 8c of Paper I. (b) Result of parametric linear de-dispersion and spectral integration of (a), as a function of slope (left scale) or drift rate (right scale). The dashed horizontal line about -500 MHz/s indicates the drift rate for which most of the burst clusters of (a) align. (c) Standard deviation of each line of (b) (actually exponential of values of (b) are used to enhance the contrast). The dashed vertical line indicates the peak value, obtained at −514 MHz/s. (d) Distribution of overall drift rates computed in 20 s × 30 MHz intervals between 1000 and 1150 MHz. For each of the 5 frequency intervals, the diamond indicates the average overall drift rate and the ‘+’ the 10 % and 90% quantiles of their distribution. The solid line is the linear fit of the average values, and the dashed lines those of the quantiles. The lower values about -1000 MHz/s are ‘saturated’ by the time resolution of the original dynamic spectrum (a), which prevents us from distinguishing clearly between drift rates steeper than -1000 MHz/s; we thus limited our parametric de-dispersion to that value.
Current usage metrics show cumulative count of Article Views (full-text article views including HTML views, PDF and ePub downloads, according to the available data) and Abstracts Views on Vision4Press platform.
Data correspond to usage on the plateform after 2015. The current usage metrics is available 48-96 hours after online publication and is updated daily on week days.
Initial download of the metrics may take a while.