Fig. 1
Download original image
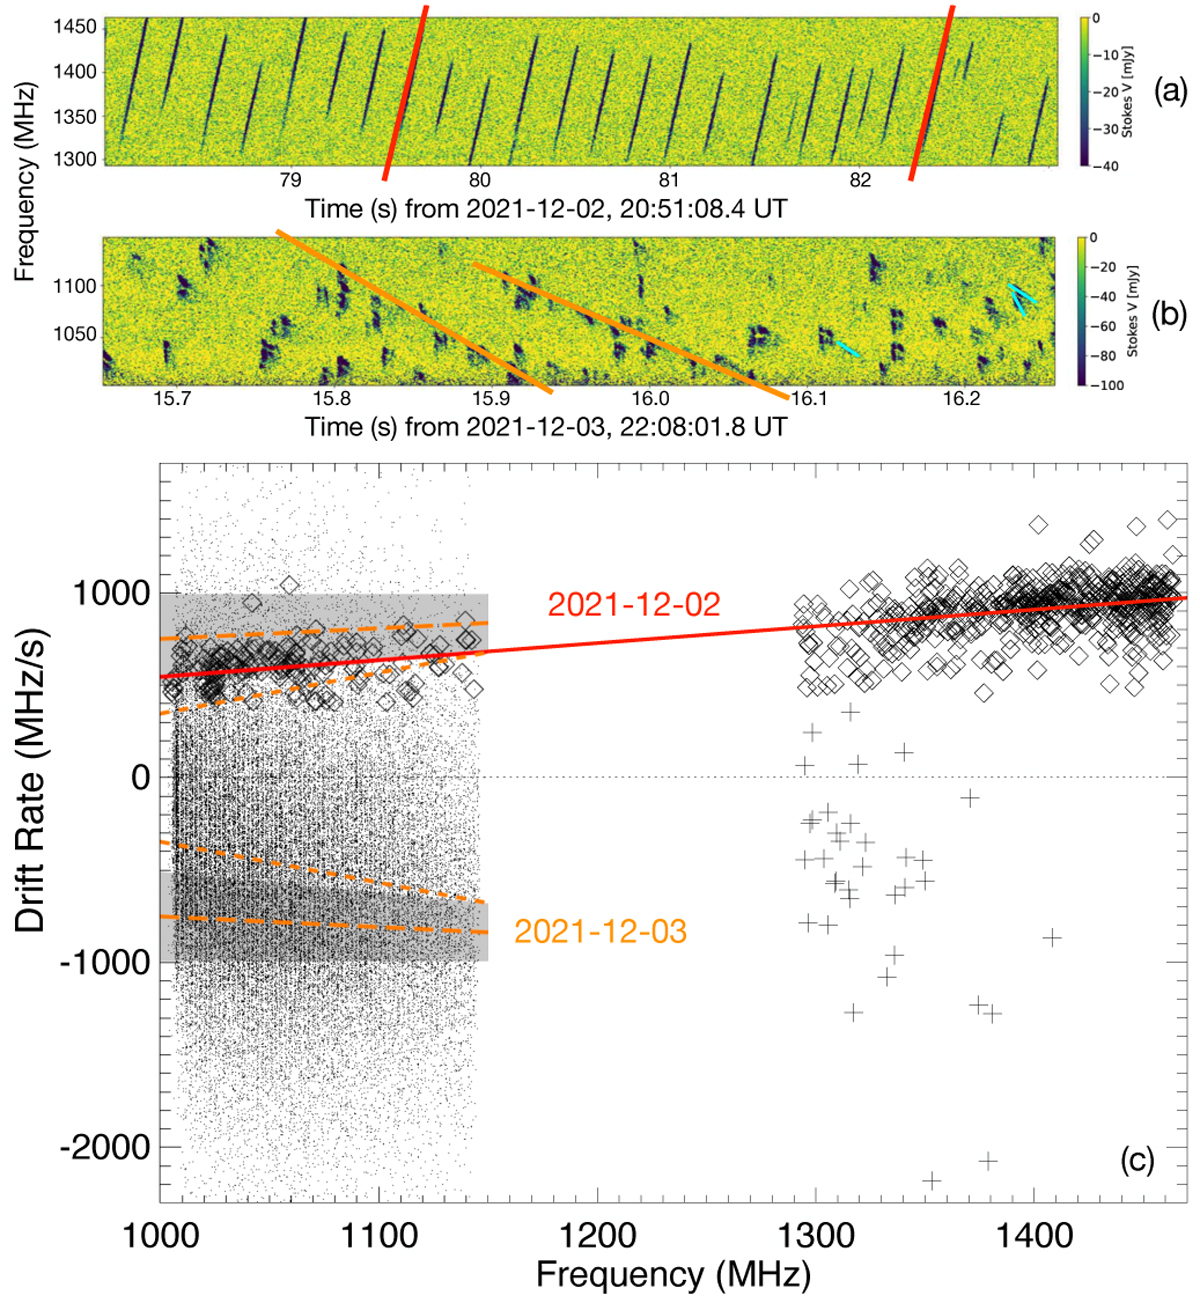
Bursts and drift rates (df /dt) observed with FAST. (a) Representative examples of bursts observed on 2 December. Many linearly drifting discrete bursts show up clearly. About 700 individual bursts were identified and their drift rate measured across the observed frequency range (examples are displayed in red). With FAST, negative Stokes V correspond to LH circular polarisation (Wang et al. 2023). (b) Representative examples of bursts observed on 3 December. Their morphology is quite different from the previous day. About 50 000 individual sub-bursts were identified and their instantaneous drift rate estimated (examples are displayed in light blue). Examples of overall drifts of sub-burst alignments are displayed in orange. (c) Individual burst drifts on 2 December are displayed as diamonds, and their linear dependence versus the frequency is the best fit red line (similar to Paper I). Individual sub-burst drifts on 3 December are displayed as dots below 1150 MHz and ‘+’ above 1290 MHz. Their distribution is much more dispersed than the one on the previous day. The best fit linear trend of df/dt(f) for individual sub-burst is the short-dashed orange line between –350 and –680 MHz. Overall drifts of sub-burst trains or clusters are largely spread between –500 and –1000 MHz/s (lower grey-shaded region) and display a small statistical variation between about –750 MHz at 1000 MHz and –840 MHz at 1150 MHz (long- dashed orange line). Determination of these overall drifts is detailed in Appendix A. The upper grey-shaded region and dashed orange lines are the symmetrical of the lower ones with respect to the df /dt = 0 dotted line.
Current usage metrics show cumulative count of Article Views (full-text article views including HTML views, PDF and ePub downloads, according to the available data) and Abstracts Views on Vision4Press platform.
Data correspond to usage on the plateform after 2015. The current usage metrics is available 48-96 hours after online publication and is updated daily on week days.
Initial download of the metrics may take a while.