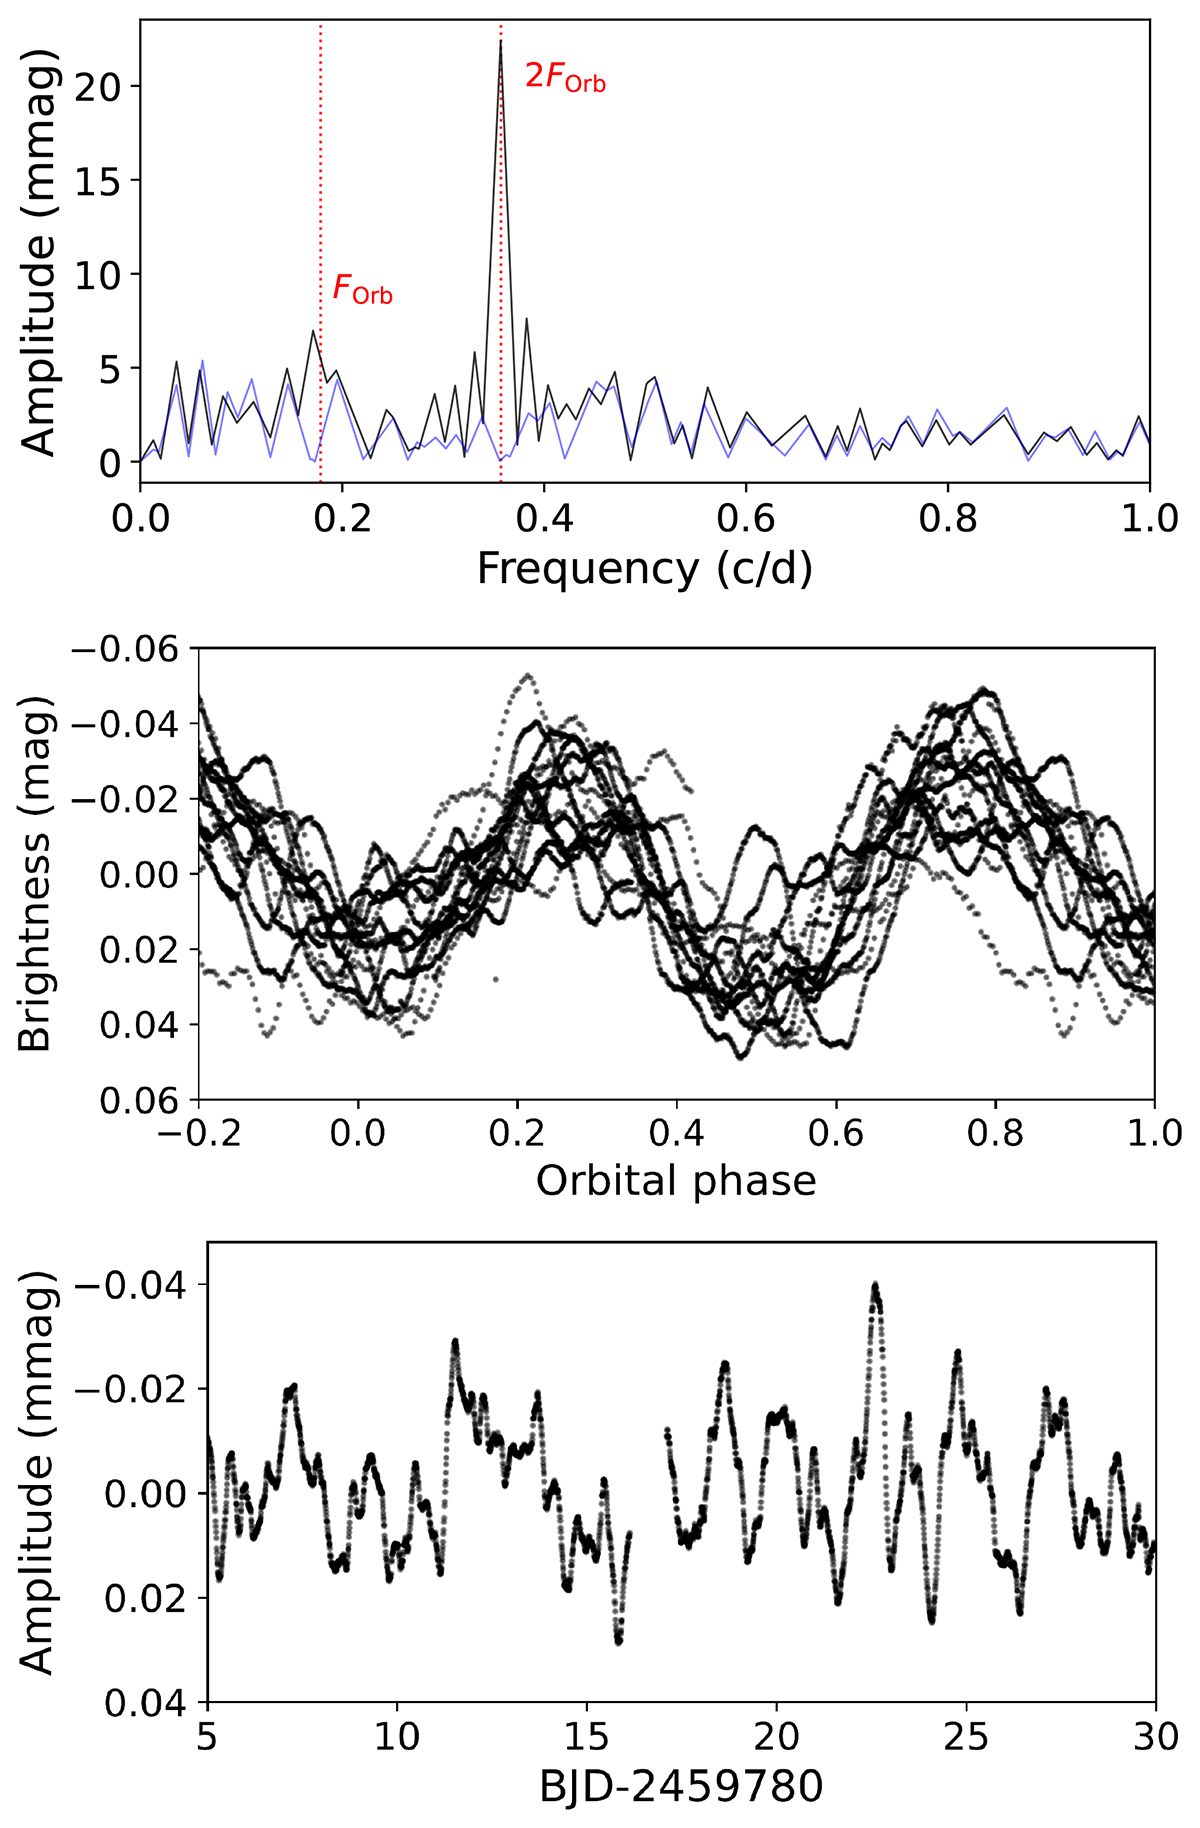
Fig. 5.
Download original image
Top panel: Fourier transform of the full QLP dataset showing the orbital frequency and its harmonic (in black) and the residuals after pre-whitening (in blue). Middle panel: data phase-folded with the orbital period and ephemeris from Gies et al. (2003). Bottom panel: stochastic variations after the ellipsoidal variations were removed.
Current usage metrics show cumulative count of Article Views (full-text article views including HTML views, PDF and ePub downloads, according to the available data) and Abstracts Views on Vision4Press platform.
Data correspond to usage on the plateform after 2015. The current usage metrics is available 48-96 hours after online publication and is updated daily on week days.
Initial download of the metrics may take a while.