Fig. 3.
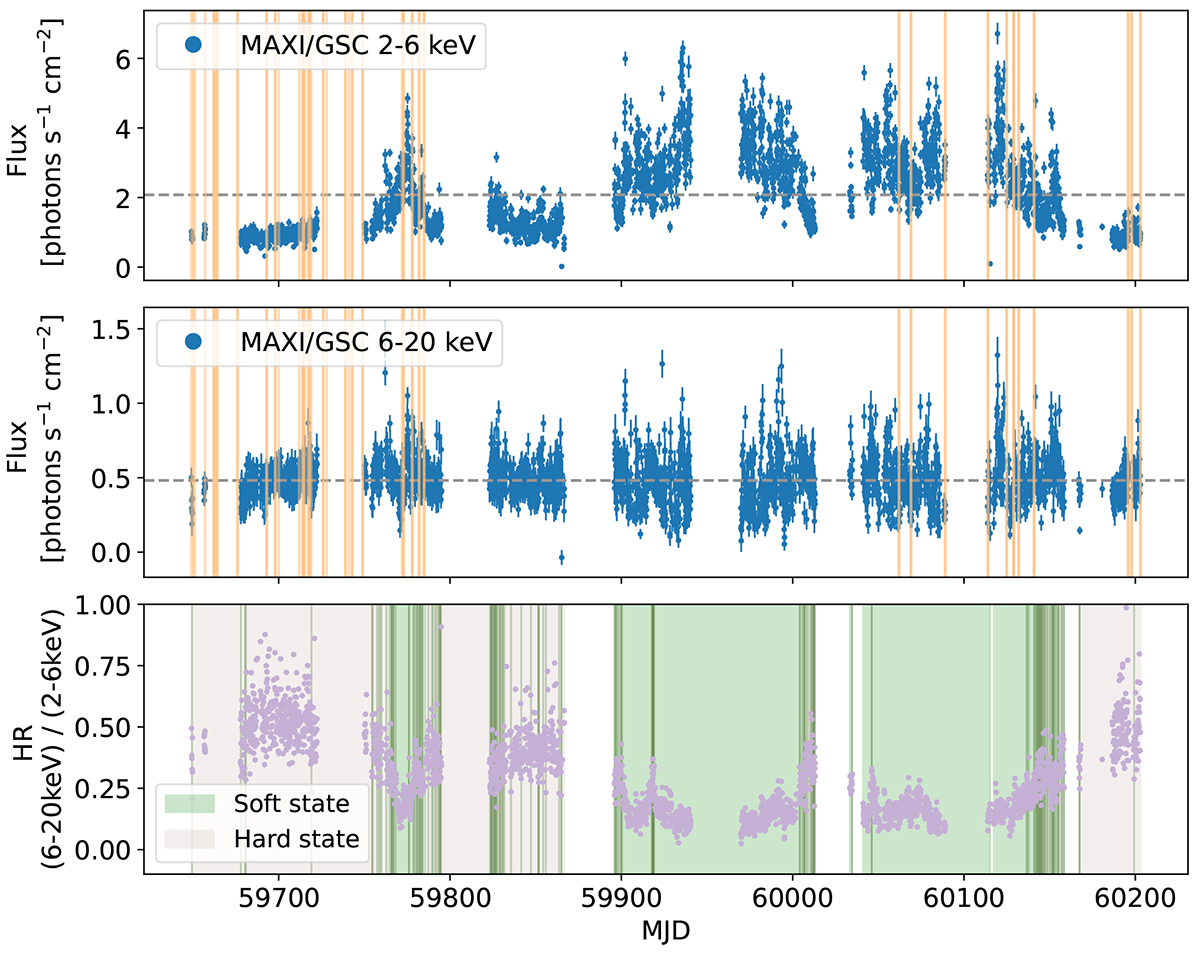
Download original image
MAXI/GSC X-ray light curves and hardness ratio calculated between March 2022 and September 2023 over the energy range 2–20 keV, with a 0.1 day time bin (≈2 hours). Upper panel: light curve in the 2–6 keV energy range. Middle panel: light curve in the 6–20 keV energy range. In the upper and middle panels, the orange vertical lines indicate the simultaneous optical observations with the Perek telescope, and the horizontal dashed gray lines indicate the mean value of the X-ray flux. Lower panel: hardness ratio calculated as the ratio between the count rates in the 6–20 keV energy range over the count rates in the 2–6 keV energy range. The green-shaded regions show the period when the system is considered to be in the soft-intermediate X-ray state and the brown-shaded regions show when the system was in the hard state.
Current usage metrics show cumulative count of Article Views (full-text article views including HTML views, PDF and ePub downloads, according to the available data) and Abstracts Views on Vision4Press platform.
Data correspond to usage on the plateform after 2015. The current usage metrics is available 48-96 hours after online publication and is updated daily on week days.
Initial download of the metrics may take a while.