Fig. 10.
Download original image
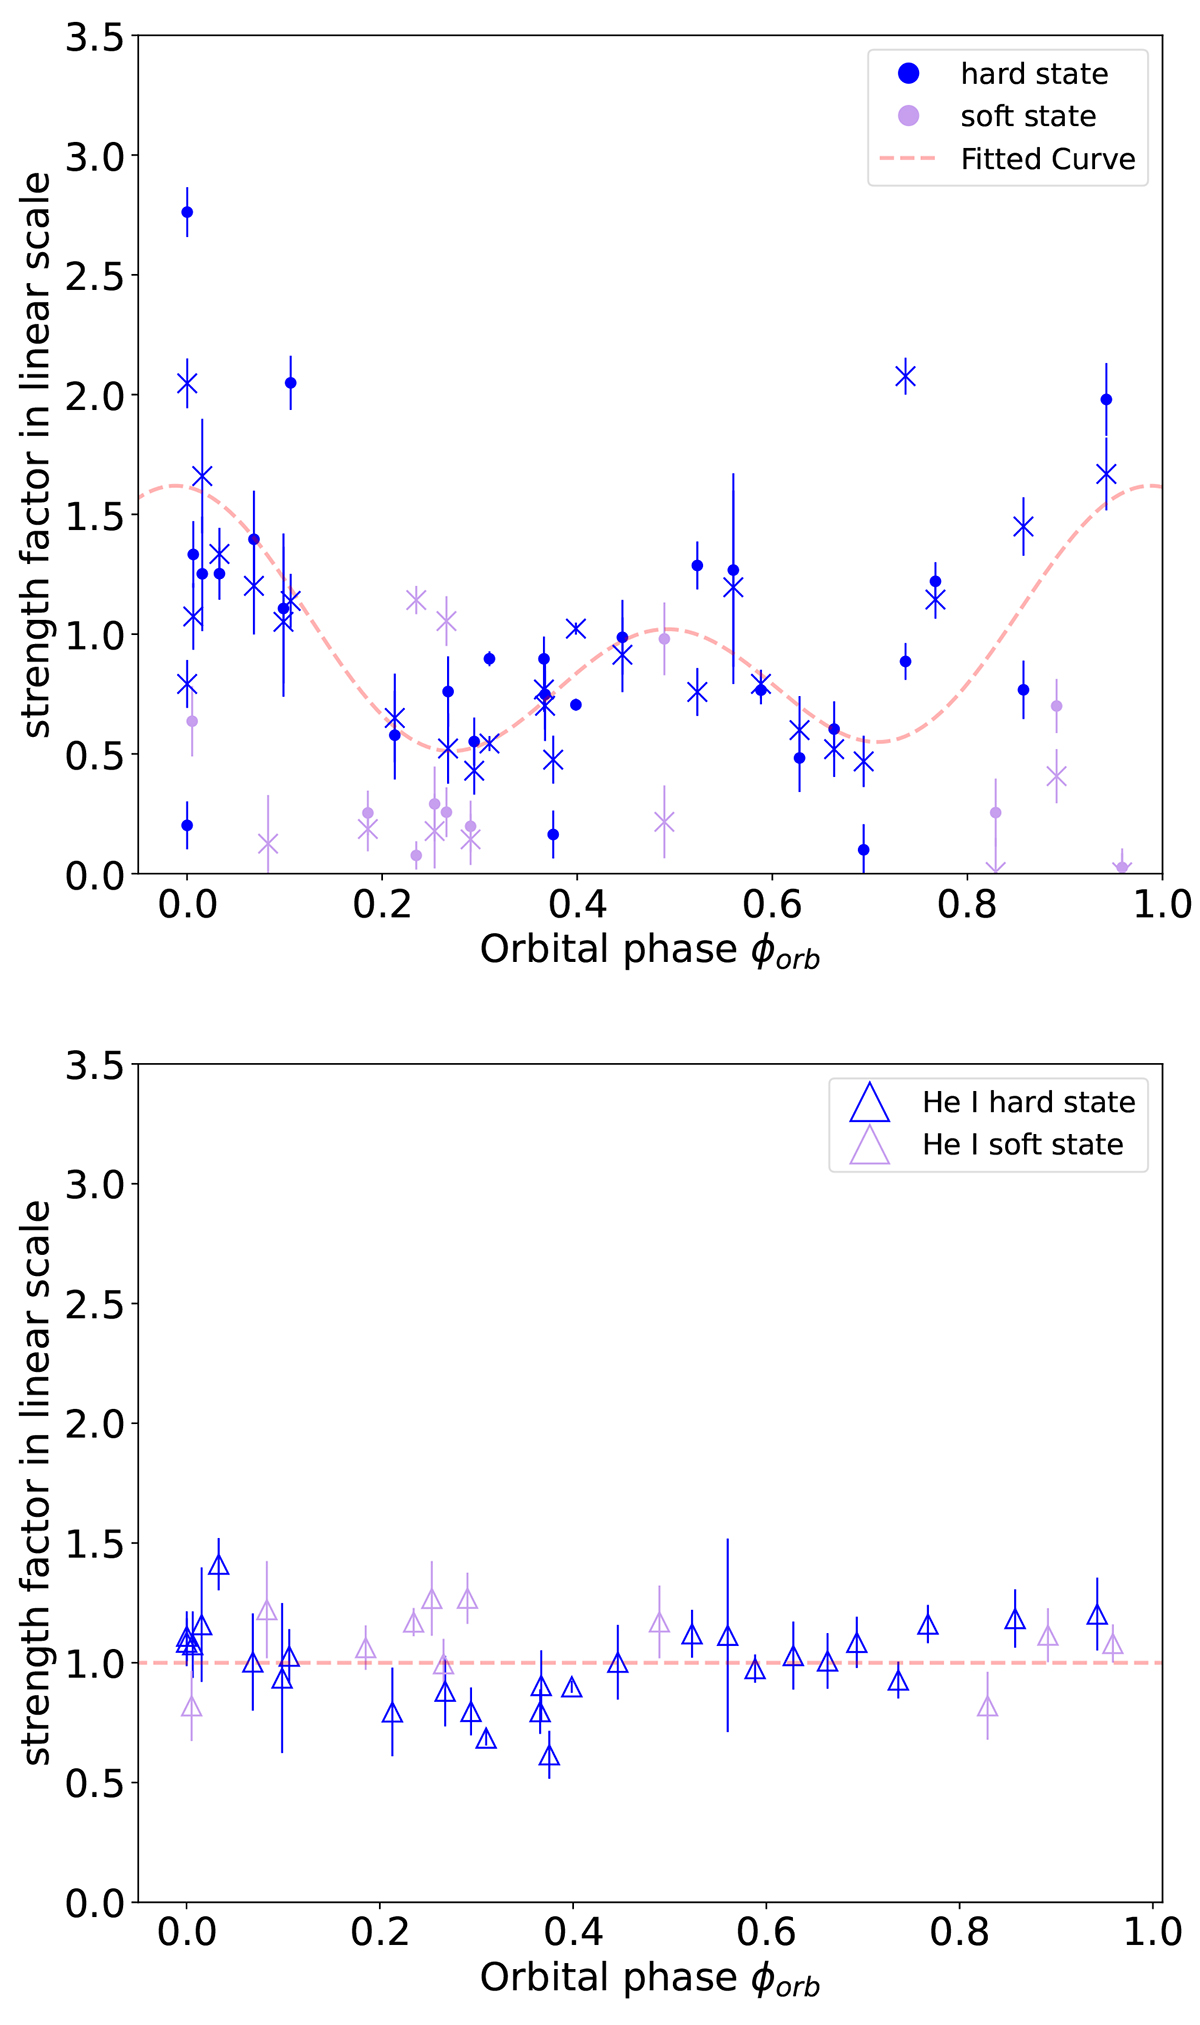
Evolution of the strength factors with respect to the orbital phase. Top: for Hα λ6562 (circles) and He II λ4686 (crosses), for the stellar atmosphere component. The dashed red curve shows the best fit from the Fourier analysis. Bottom: for He I λ6678, for the stellar atmosphere component. The horizontal dashed red curve shows the mean value of the strength factors.
Current usage metrics show cumulative count of Article Views (full-text article views including HTML views, PDF and ePub downloads, according to the available data) and Abstracts Views on Vision4Press platform.
Data correspond to usage on the plateform after 2015. The current usage metrics is available 48-96 hours after online publication and is updated daily on week days.
Initial download of the metrics may take a while.