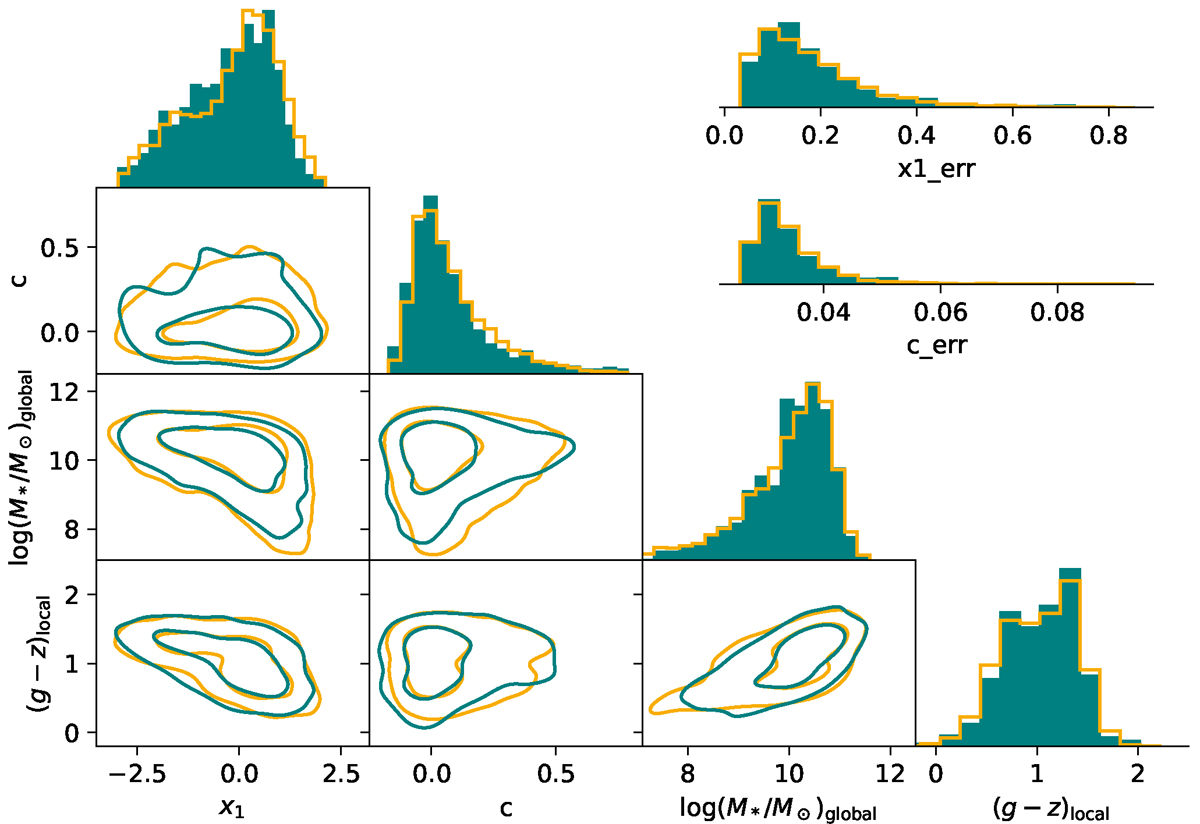
Fig. A.1.
Download original image
Corner plot: Correlation between SN Ia light-curve stretch (x1), colour (c), host mass and environmental local colour for the data (teal) and our realistic simulations (orange). Lines in the non-histogram panels show the contours containing 90% and 50% of the data (teal) and simulated points (orange). Top-right: Distribution of the stretch and colour errors following the corner-plot colour code.
Current usage metrics show cumulative count of Article Views (full-text article views including HTML views, PDF and ePub downloads, according to the available data) and Abstracts Views on Vision4Press platform.
Data correspond to usage on the plateform after 2015. The current usage metrics is available 48-96 hours after online publication and is updated daily on week days.
Initial download of the metrics may take a while.