Fig. 1

Download original image
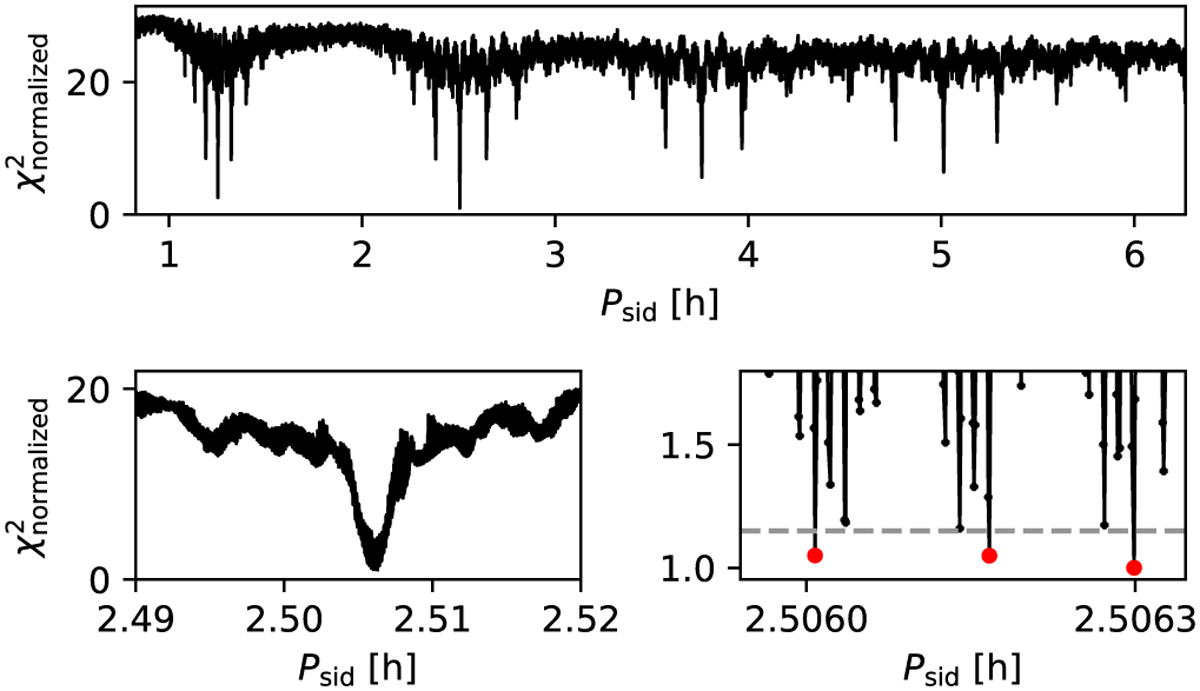
Periodogram for asteroid (7025) 1993 QA. Top panel: normalized χ2 vs. Psid across the tested range of periods with a step size of 0.8∆P. Bottom left: resampled region around the global minimum with steps of 0.1∆P. Bottom right: closer view of the global minimum, revealing aliases caused by long gaps between apparitions. Periods corresponding to local χ2 minima (red dots) below the 3σ threshold (dashed line) were considered for further analysis.
Current usage metrics show cumulative count of Article Views (full-text article views including HTML views, PDF and ePub downloads, according to the available data) and Abstracts Views on Vision4Press platform.
Data correspond to usage on the plateform after 2015. The current usage metrics is available 48-96 hours after online publication and is updated daily on week days.
Initial download of the metrics may take a while.


