Fig. 4.
Download original image
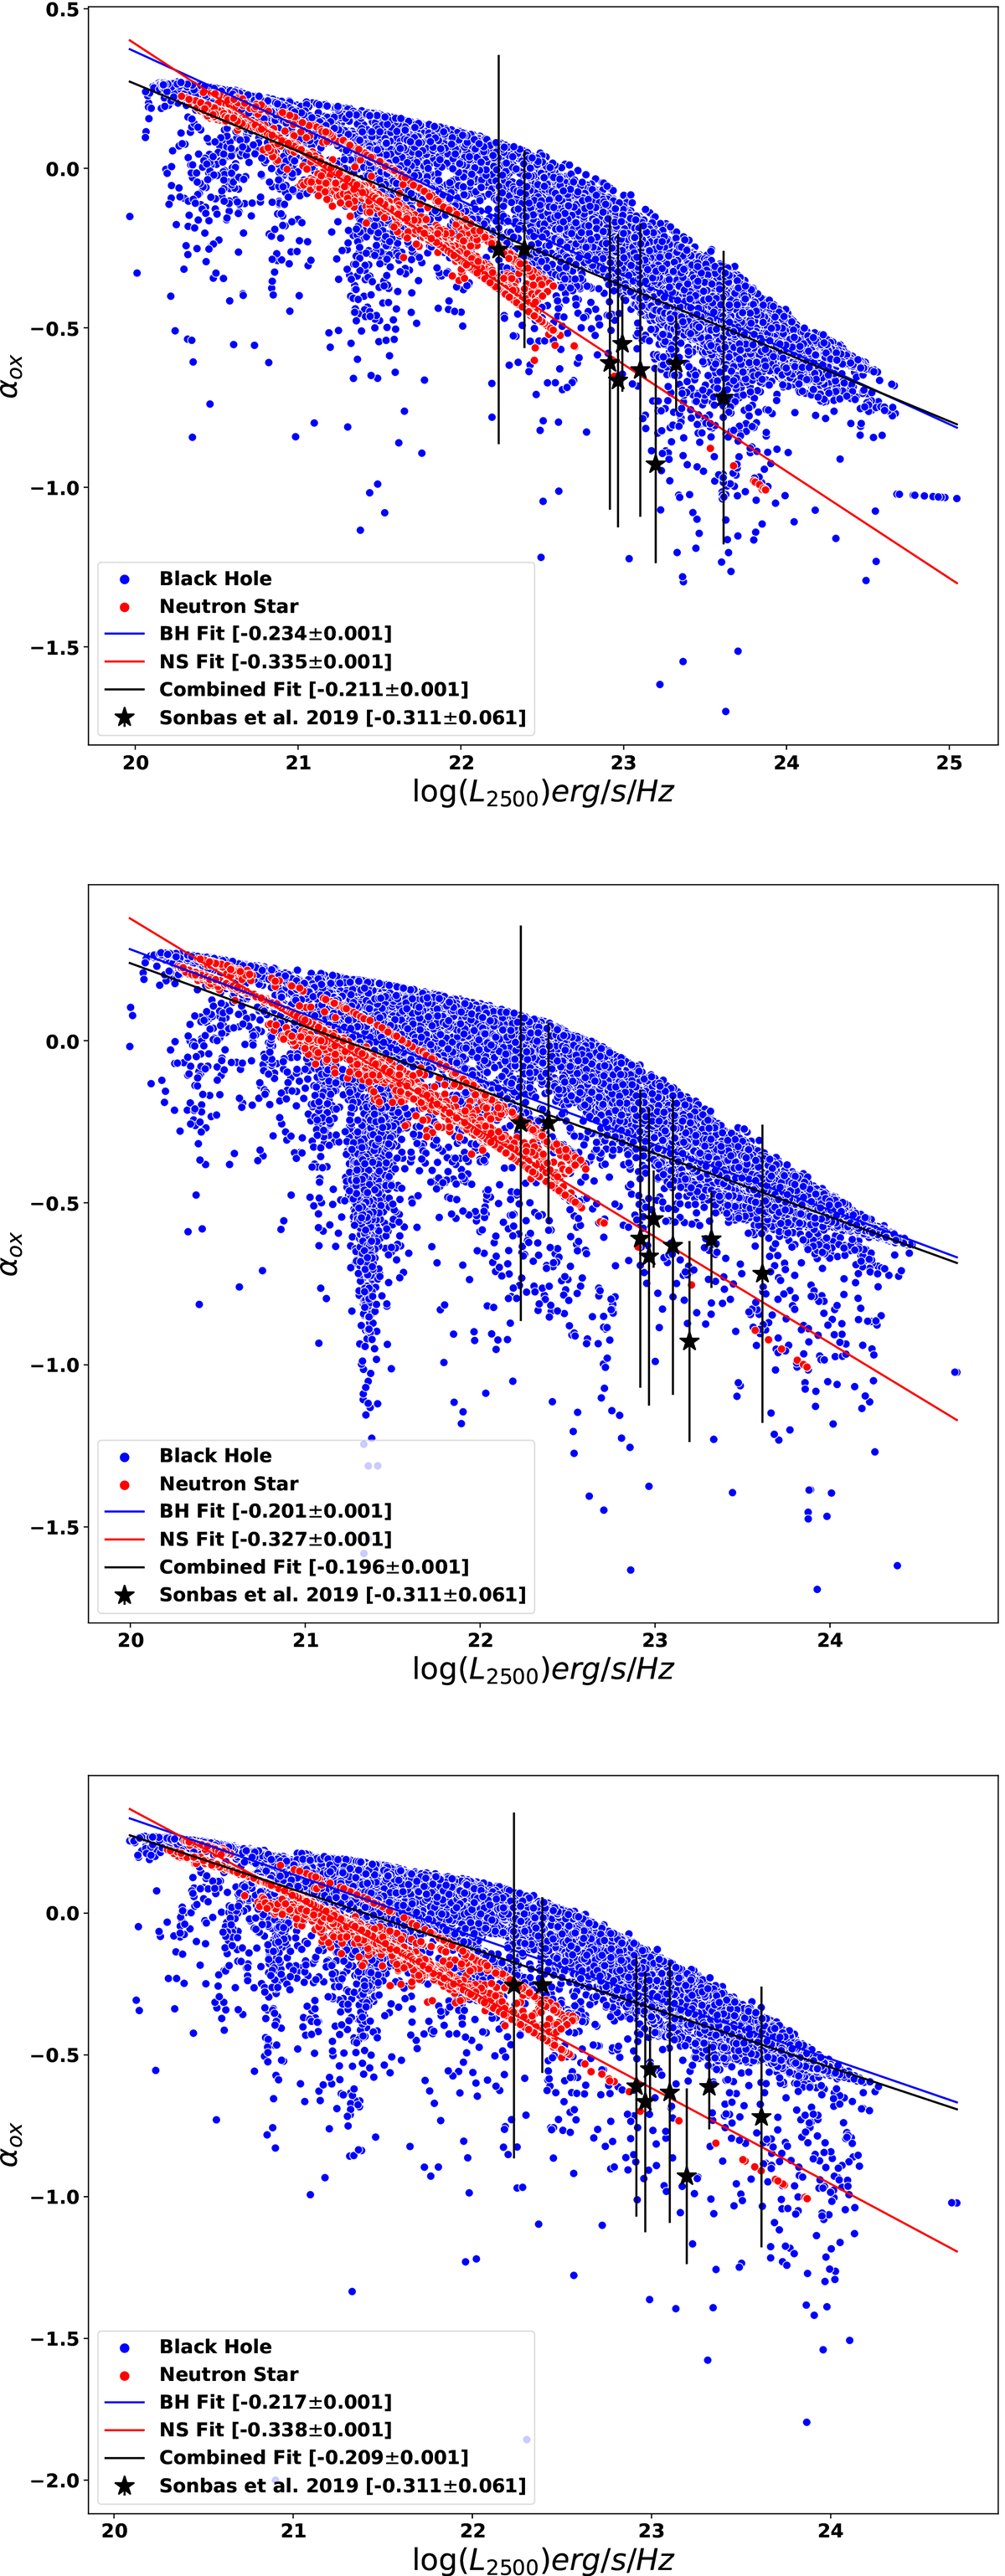
αox index as function of Lν,UV (2500 Å) luminosity for our simulated ULX population (BH or NS primaries). The best fit to αox − Lν,UV simulated data in our population (black solid line) and observed ULXs data in Sonbas et al. (2019) (black points) are also shown. The top, middle, and bottom panels correspond to metallicities of 0.025 Z⊙, 0.20 Z⊙, and 0.40 Z⊙, respectively. We also show the αox − Lν,UV fits for the BH-ULX and NS-ULX systems separately.
Current usage metrics show cumulative count of Article Views (full-text article views including HTML views, PDF and ePub downloads, according to the available data) and Abstracts Views on Vision4Press platform.
Data correspond to usage on the plateform after 2015. The current usage metrics is available 48-96 hours after online publication and is updated daily on week days.
Initial download of the metrics may take a while.