Fig. 1.
Download original image
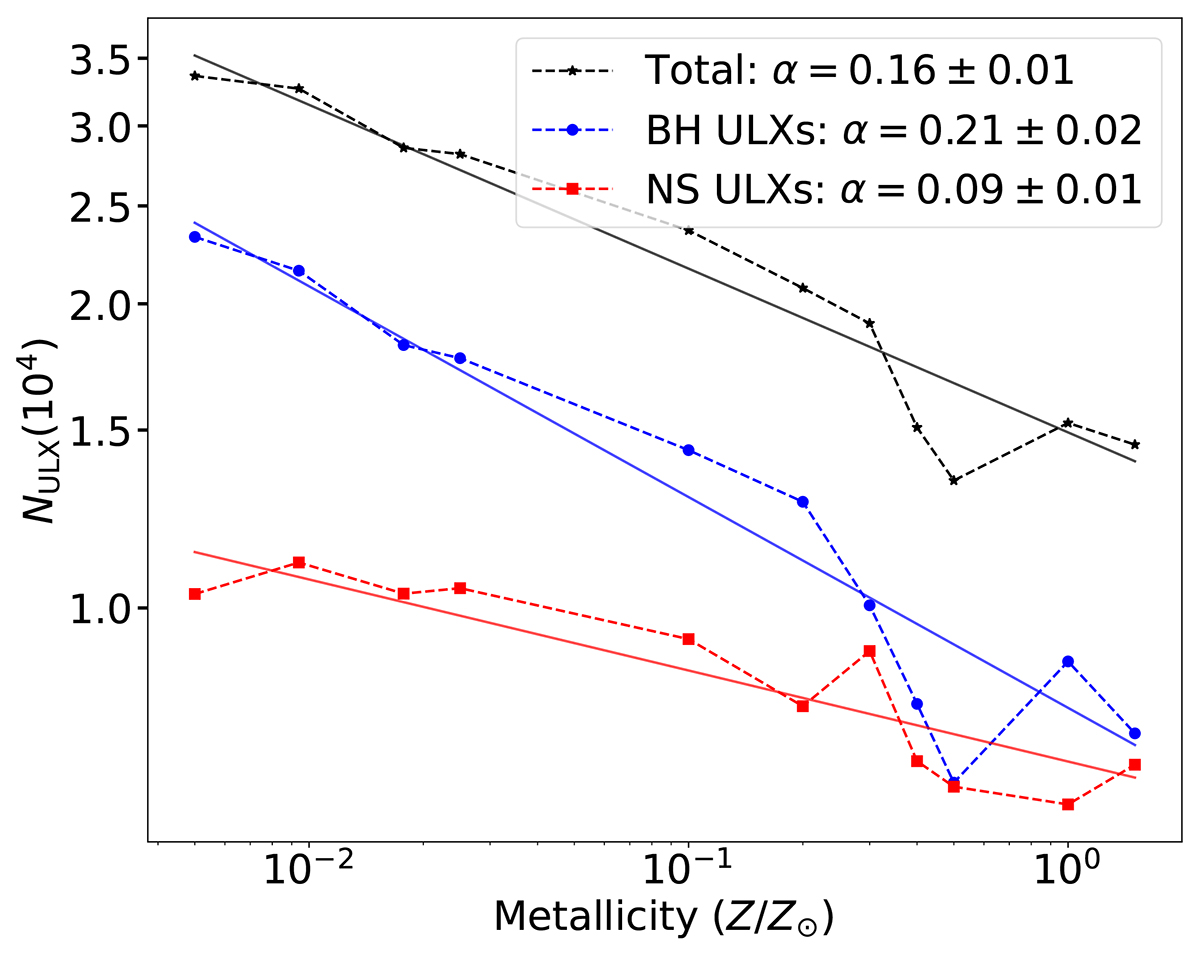
Number of ULXs formed in our simulation (NULX) as a function of metallicity. The y-axis indicates the number of ULXs derived from the simulations, with emphasis placed on the trend’s shape rather than the absolute values. The solid lines represent fits to the simulated data, with the corresponding slopes mentioned in the legend.
Current usage metrics show cumulative count of Article Views (full-text article views including HTML views, PDF and ePub downloads, according to the available data) and Abstracts Views on Vision4Press platform.
Data correspond to usage on the plateform after 2015. The current usage metrics is available 48-96 hours after online publication and is updated daily on week days.
Initial download of the metrics may take a while.