Open Access
Fig. 9
Download original image
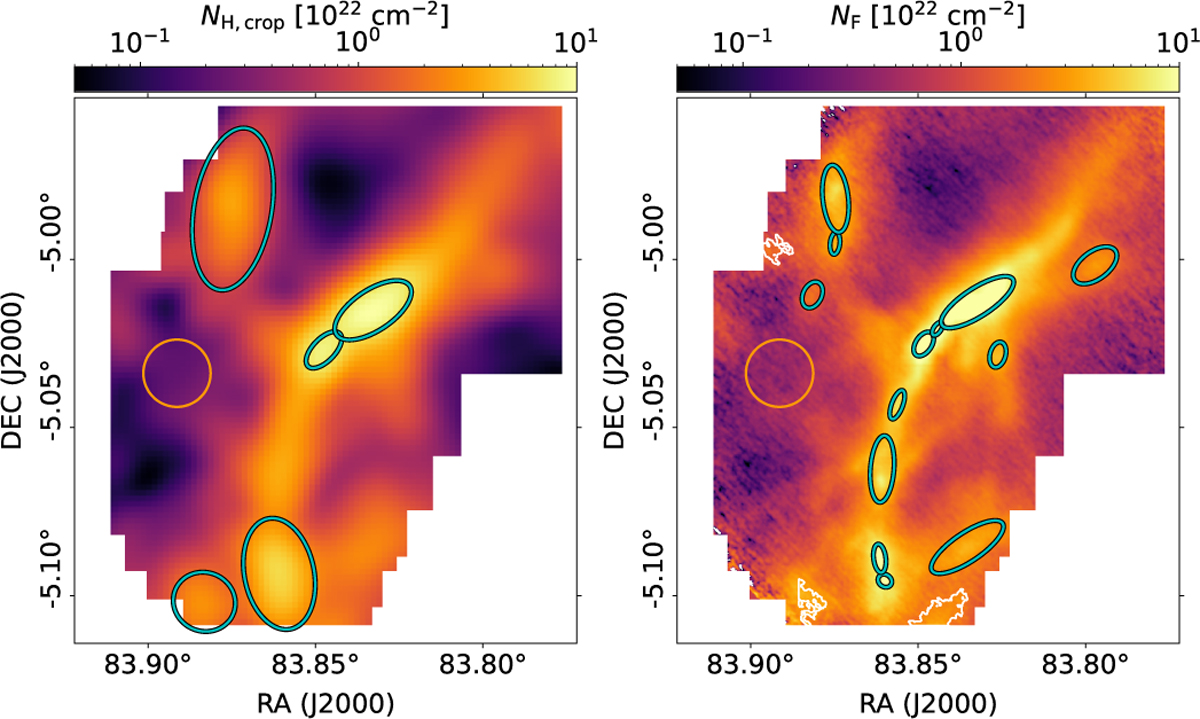
Clump ellipses (cyan) plotted on top of the Nℋ,crop (left) and Nℱ (right) column density maps. The three clumps removed from analysis are drawn with white outlines on the Nℱ map. The orange circle shows the region used for determining the RMS noise.
Current usage metrics show cumulative count of Article Views (full-text article views including HTML views, PDF and ePub downloads, according to the available data) and Abstracts Views on Vision4Press platform.
Data correspond to usage on the plateform after 2015. The current usage metrics is available 48-96 hours after online publication and is updated daily on week days.
Initial download of the metrics may take a while.