Fig. 7
Download original image
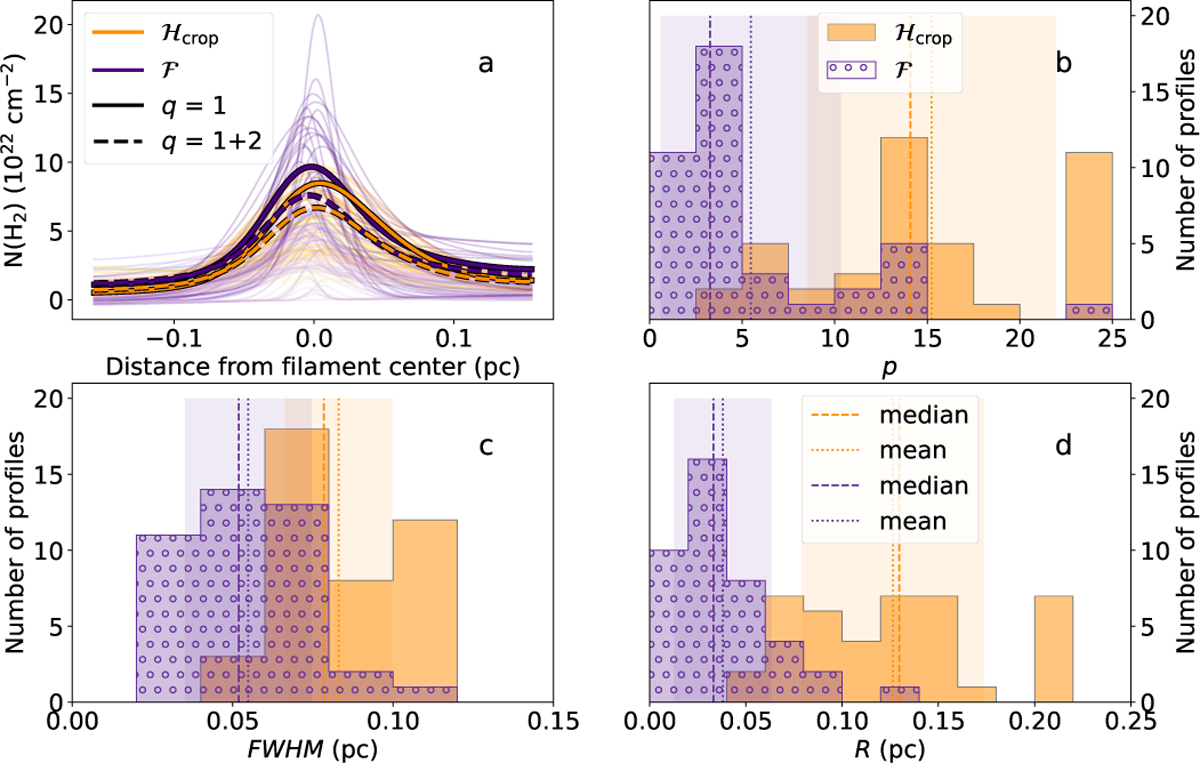
Comparison of G208 Nℱ and Nℋ,crop filament shapes. Frame a: Profiles of Nℋ (orange) and Nℱ (purple) q = 1–2 filaments. Median profiles are plotted with solid and dashed lines for q = 1 and q = 2 profiles, respectively. Frames b-d: histograms of p (b), Rflat (d), and FWHM (c) for all q = 1–2 filaments in field G208. Medians and means for each distributions are plotted in dashed and dotted lines, respectively. The shaded areas correspond to the central 1-σ regions of the distributions.
Current usage metrics show cumulative count of Article Views (full-text article views including HTML views, PDF and ePub downloads, according to the available data) and Abstracts Views on Vision4Press platform.
Data correspond to usage on the plateform after 2015. The current usage metrics is available 48-96 hours after online publication and is updated daily on week days.
Initial download of the metrics may take a while.