Open Access
Fig. 6
Download original image
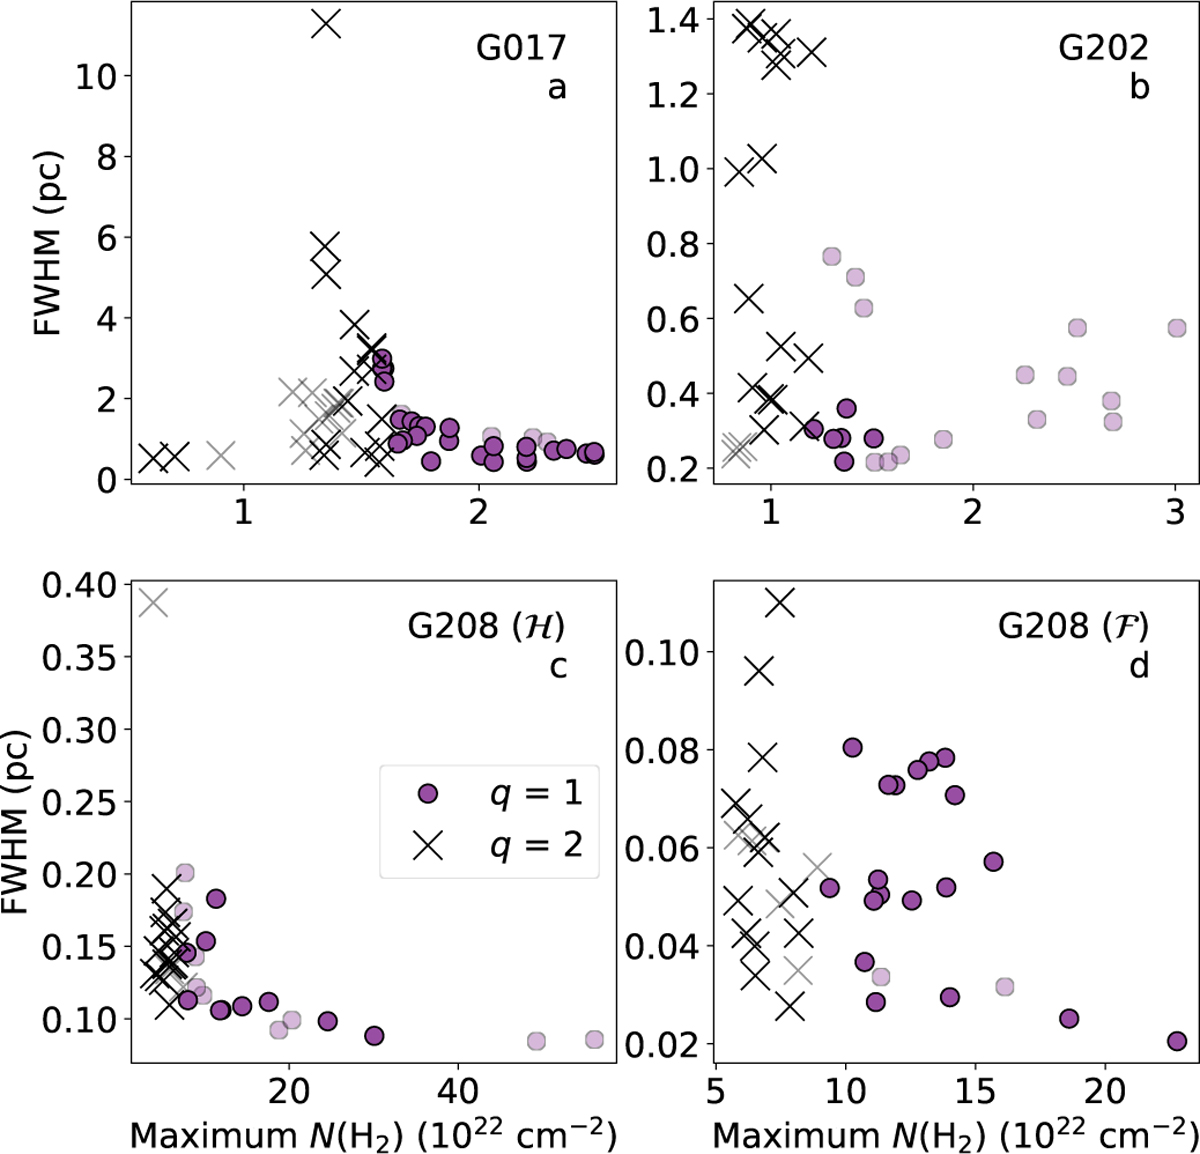
Plummer FWHM plotted against the column density at the filament spine for Herschel fields G17 (a), G202 (b), and G208 (c), and the Nℱ map (d), for filaments of quality 1 (purple circles) and 2 (black crosses). Transparent symbols show profiles for which p > 10.
Current usage metrics show cumulative count of Article Views (full-text article views including HTML views, PDF and ePub downloads, according to the available data) and Abstracts Views on Vision4Press platform.
Data correspond to usage on the plateform after 2015. The current usage metrics is available 48-96 hours after online publication and is updated daily on week days.
Initial download of the metrics may take a while.