Fig. 5
Download original image
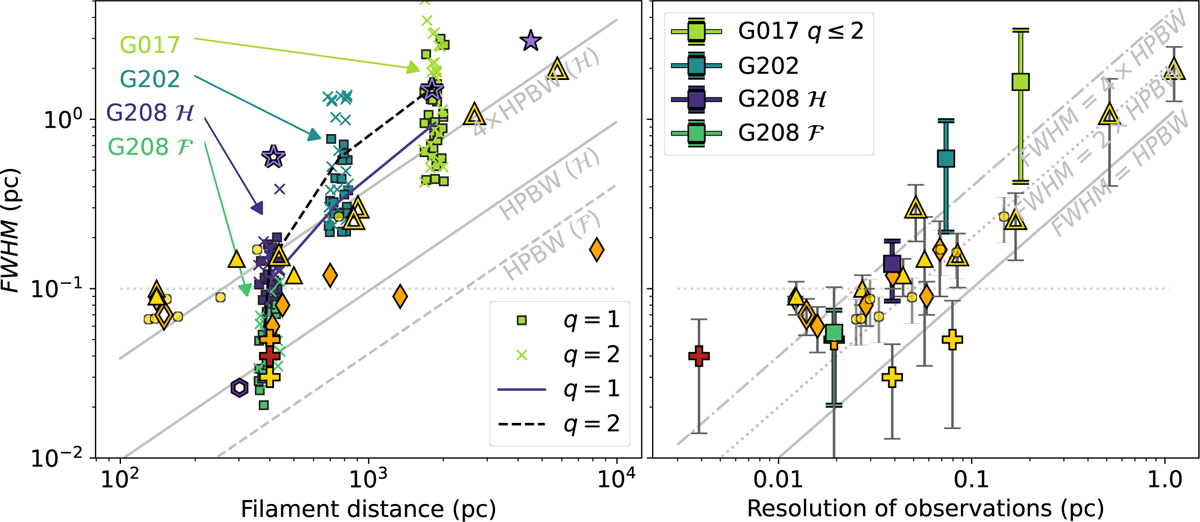
Observed dependence of FWHM on filament distance and observational resolution. Left: FWHM from asymmetric fits plotted against the distance of the field of each q = 1–2 profile (squares and crosses, respectively). For readability, the distance values include small added jitter. Median of each distribution is plotted with a solid line (q = 1) and dashed line (q = 2). Grey lines show the proposed relation of FWHM = 4 × HPBW (Panopoulou et al. 2022), as well as the Herschel (solid line) and ArTéMiS (dashed line) beamsizes. Right: Median value of each q = 1–2 dataset as a function of observational resolution in pc (solid squares). The errorbars represent the standard deviation of the FWHM widths in each dataset. Grey lines show relations of FWHM = [1,2,4] × HPBW. In both frames, we also include values from the literature (see text for references): Herschel continuum (yellow triangles), other continuum (orange diamonds), mean deconvolved filament widths from Fig. 1 of Panopoulou et al. (2022) (yellow circles), and values from Juvela & Mannfors (2023) with solid plusses (LR and HR in yellow, AR with orange, and MIR with red). The errorbars represent either the published uncertainty or a 30% uncertainty on the FWHM. In the left frame only, we show additional literature values from CO (purple stars) and NH3 (purple hexagon) observations. Solid symbols represents deconvolved widths, those without beam deconvolution are shown with outlines.
Current usage metrics show cumulative count of Article Views (full-text article views including HTML views, PDF and ePub downloads, according to the available data) and Abstracts Views on Vision4Press platform.
Data correspond to usage on the plateform after 2015. The current usage metrics is available 48-96 hours after online publication and is updated daily on week days.
Initial download of the metrics may take a while.