Fig. 3
Download original image
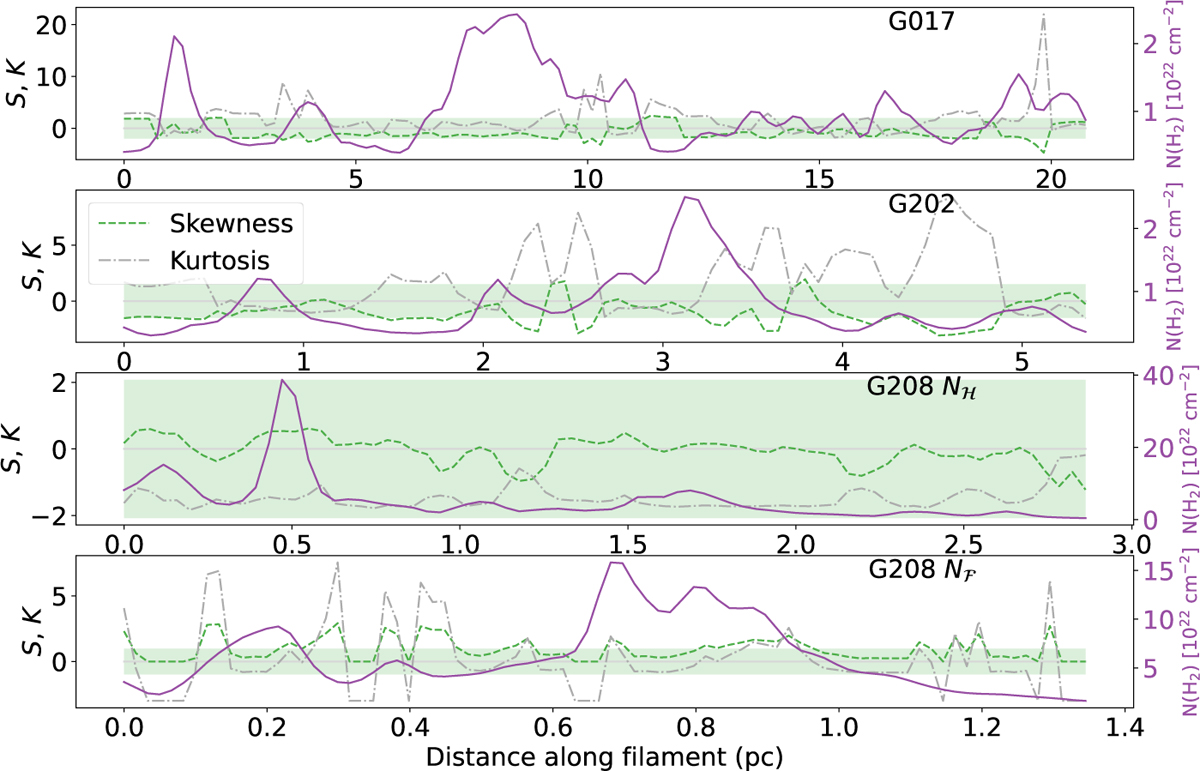
Skewness (green dashed line) and kurtosis (gray dash-dotted line) along the filament spine of G17, G202, and G208 Nℋ and Nℱ. The right-hand y-axis shows column density along the filament spine (purple solid line). The faint gray horizontal line marks K = S = 0. S which falls outside of the green highlighted region is significant (see Sect. 4.2.1).
Current usage metrics show cumulative count of Article Views (full-text article views including HTML views, PDF and ePub downloads, according to the available data) and Abstracts Views on Vision4Press platform.
Data correspond to usage on the plateform after 2015. The current usage metrics is available 48-96 hours after online publication and is updated daily on week days.
Initial download of the metrics may take a while.