Fig. A.6
Download original image
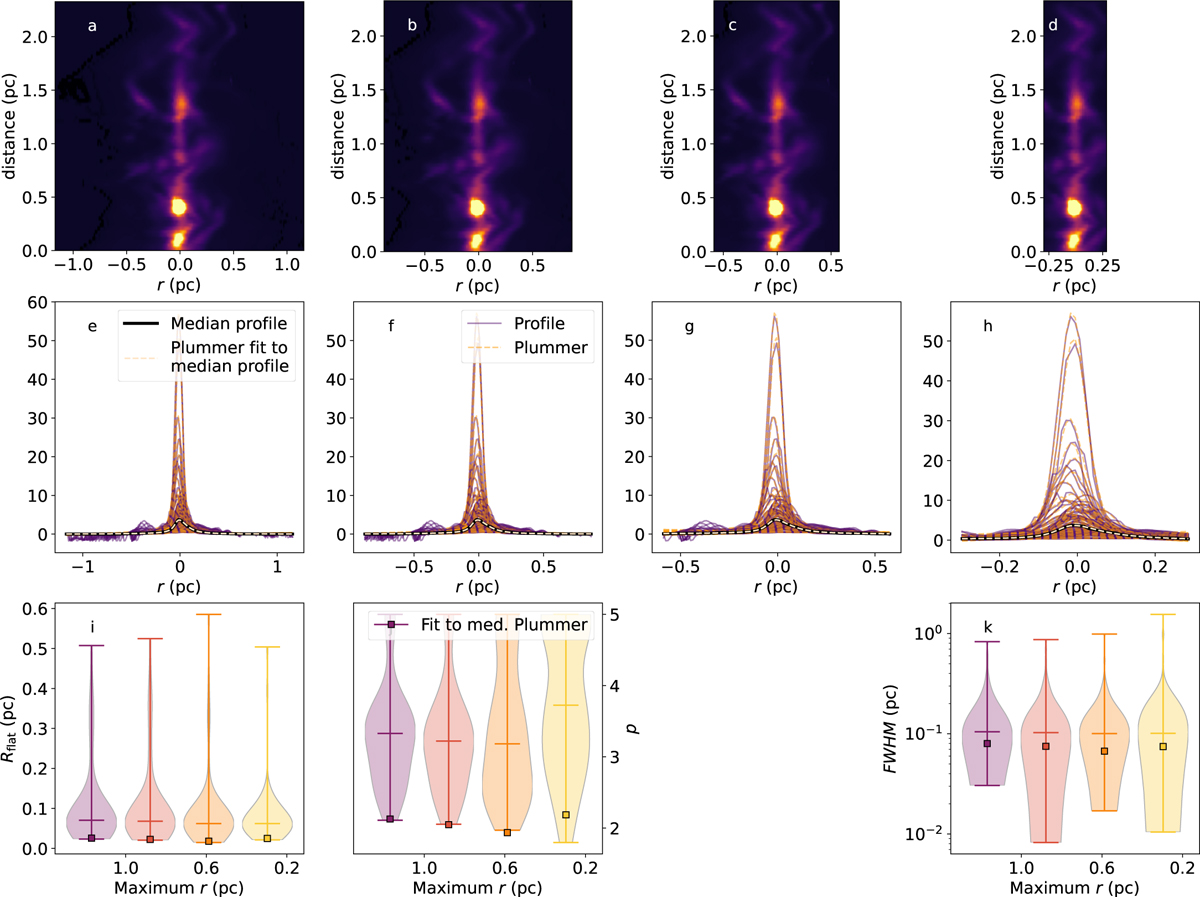
Simulation of the relation between fitted area from filament center and derived Plummer parameters. Top row (a–d) shows the data, with the original image in frame a. Middle row (e–h) show every profile in purple and the fitted Plummers in orange. The median profile is shown in black solid lines and the Plummer fit to the median Plummer in pale yellow dashed lines. The bottom row (i–k) show violin plots of filament width Rflat (frame i), slope p (frame j), and FWHM (frame k). The squares show the value for the parameter in the fit to the median profile (yellow line in the middle row). Sharp cut-offs at low values represent physical bounds set by the fitting, and are the same for all runs of this simulation.
Current usage metrics show cumulative count of Article Views (full-text article views including HTML views, PDF and ePub downloads, according to the available data) and Abstracts Views on Vision4Press platform.
Data correspond to usage on the plateform after 2015. The current usage metrics is available 48-96 hours after online publication and is updated daily on week days.
Initial download of the metrics may take a while.