Fig. A.5
Download original image
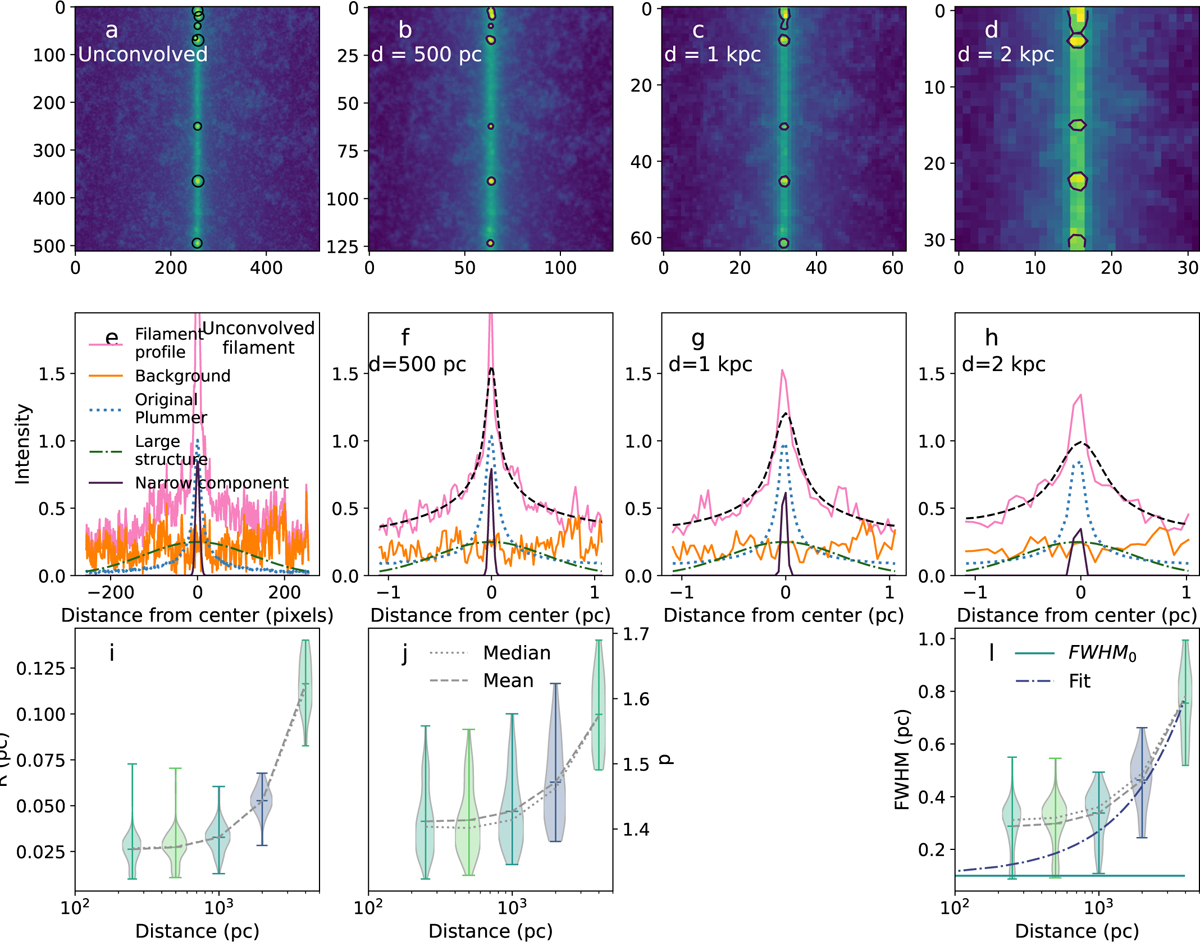
Simulated ideal filament observed at various distances. Top row: The simulated observation of the filament at the original resolution, and 500, 1000, and 2000 pc. Added Gaussian clumps are emphasized with black outlines. Middle row: Components of the observation at different distances. The background (orange solid lines), the original Plummer (blue dotted line), the wide Gaussian structure to simulate hierarchical structure (green dash-dotted lines), the mean small-scale Gaussian clump profile, and the resulting profile (pink solid lines). Frame e shows the original profile at the initial location of 125 pc, frames f-h the profiles from d = 500 pc to d = 2 kpc. The Plummer fit to the filament profile is shown with black dashed lines. Bottom row: Violin plots of derived Rflat (frame i), p (frame j), and FWHM (frame l). The mean and median values at each distance are plotted with gray lines. On frame l, we plot the intrinsic FWHM = 0.1 pc (teal solid line), as well as the fit where the FWHM of the fitted Plummer is fixed to 0.1 pc (blue dash-dotted line).
Current usage metrics show cumulative count of Article Views (full-text article views including HTML views, PDF and ePub downloads, according to the available data) and Abstracts Views on Vision4Press platform.
Data correspond to usage on the plateform after 2015. The current usage metrics is available 48-96 hours after online publication and is updated daily on week days.
Initial download of the metrics may take a while.