Fig. 2
Download original image
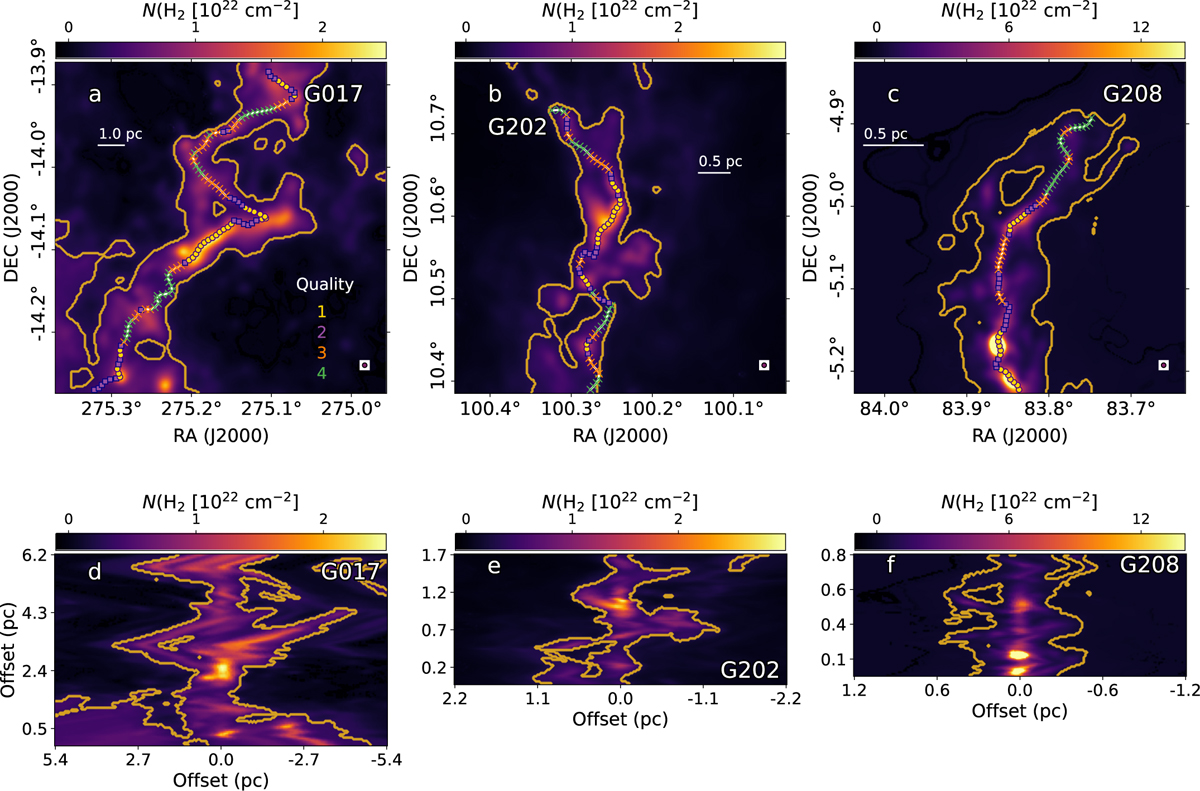
Extracted filaments on the Herschel column density maps. Top row: Column density images (FWHM = 20″) of fields G17, G202, and G208 showing the extracted filaments in each field. Filament quality is marked by color of symbols: q = 1 (yellow circles), q = 2 (purple circles), q = 3 (orange crosses), and q = 4 (green crosses). The yellow contour shows the limit of AV = 3 mag. Bottom row: Extracted filament profiles, in which the filament center is at the center of the image.
Current usage metrics show cumulative count of Article Views (full-text article views including HTML views, PDF and ePub downloads, according to the available data) and Abstracts Views on Vision4Press platform.
Data correspond to usage on the plateform after 2015. The current usage metrics is available 48-96 hours after online publication and is updated daily on week days.
Initial download of the metrics may take a while.