Fig. A.3
Download original image
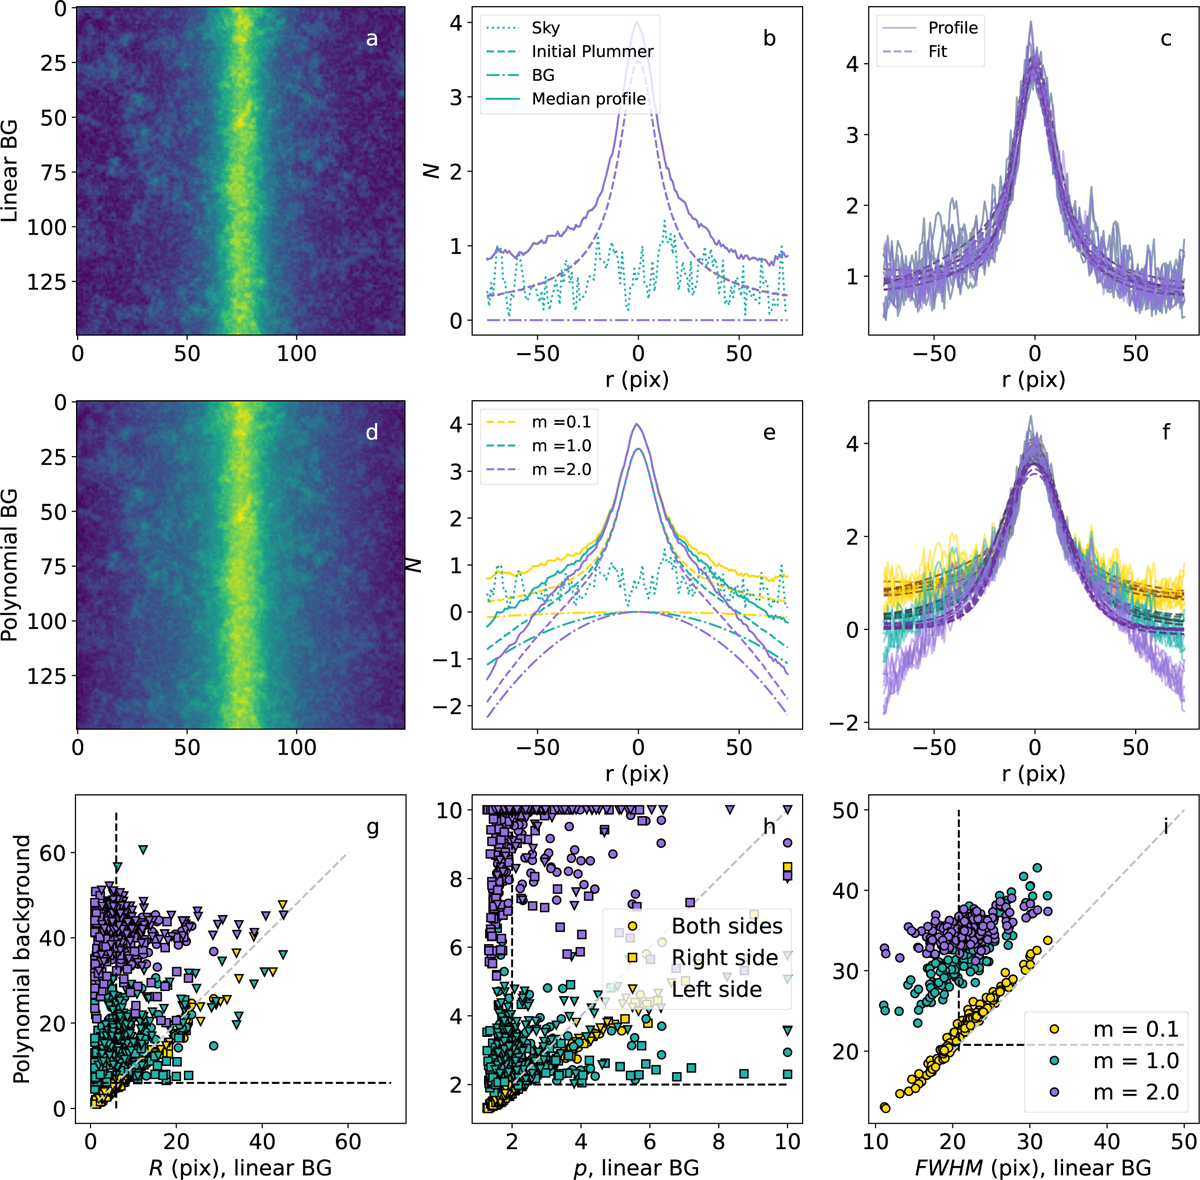
Results of simulations comparing filaments with a linear or polynomial background component. (Top row): A simulated filament with a linear background. (Middle row): A simulated filament with a polynomial background. Both filaments also have random sky fluctuations with powerlaw index k = -2. Frame a/d: The simulated filament, m = 1.0. Frame b/e: Components of the filament at different values of m: the sky (dotted line), initial Plummer (dashed line), the initial background component (dash-dotted lines), and the median profile (solid line). Yellow corresponds to the flattest background component (m = 0.1), turquoise to m = 1.0, and purple to the strongest background component (m = 2.0). Frame c/f: Individual profiles (solid lines) and Plummer fits (dashed lines) to selected profiles in each map. Colors correspond to different strengths as in the previous frames. (Bottom row): Rflat (g), p (h), and FWHM (i) calculated for the profiles with a linear background (x-axis) and a polynomial background (y-axis). Colors are as in frame e. The vertical and horizontal dashed lines mark the initial parameter value.
Current usage metrics show cumulative count of Article Views (full-text article views including HTML views, PDF and ePub downloads, according to the available data) and Abstracts Views on Vision4Press platform.
Data correspond to usage on the plateform after 2015. The current usage metrics is available 48-96 hours after online publication and is updated daily on week days.
Initial download of the metrics may take a while.