Fig. A.2
Download original image
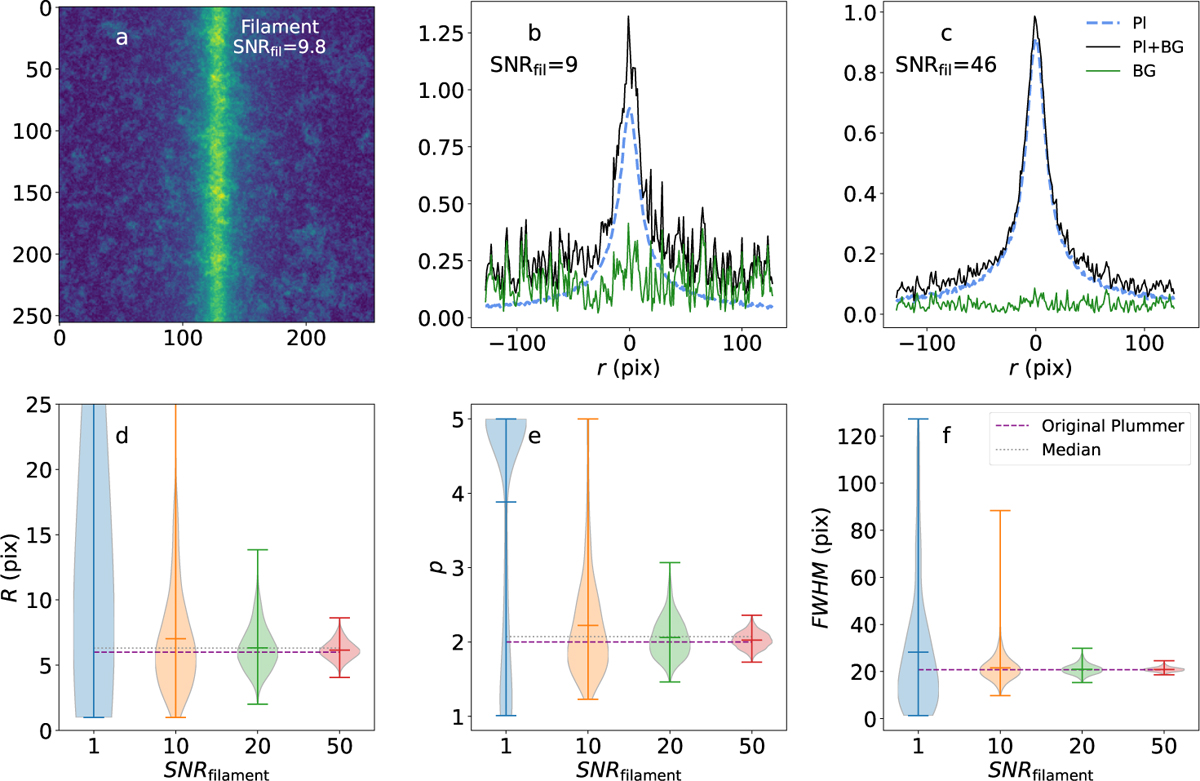
Simulation of the effect of varying background level on Plummer filament fitting. (a): The generated filament on top of the background. (b,c) The results of the fit for two different levels of background noise, with the original Plummer filament plotted with blue dashed lines, the background with green solid lines, and the sum of the Plummer and background with black lines. Frame b shows a stronger background w.r.t. the filament. (d,e,f) Violin plots of R (frame d). p (frame e), and FWHM (frame f) showing the results of the Plummer fit. Background noise decreases when moving right. The horizontal lines show the original Plummer parameters (dashed lines) and the median for our simulation (dotted line).
Current usage metrics show cumulative count of Article Views (full-text article views including HTML views, PDF and ePub downloads, according to the available data) and Abstracts Views on Vision4Press platform.
Data correspond to usage on the plateform after 2015. The current usage metrics is available 48-96 hours after online publication and is updated daily on week days.
Initial download of the metrics may take a while.