Fig. 15
Download original image
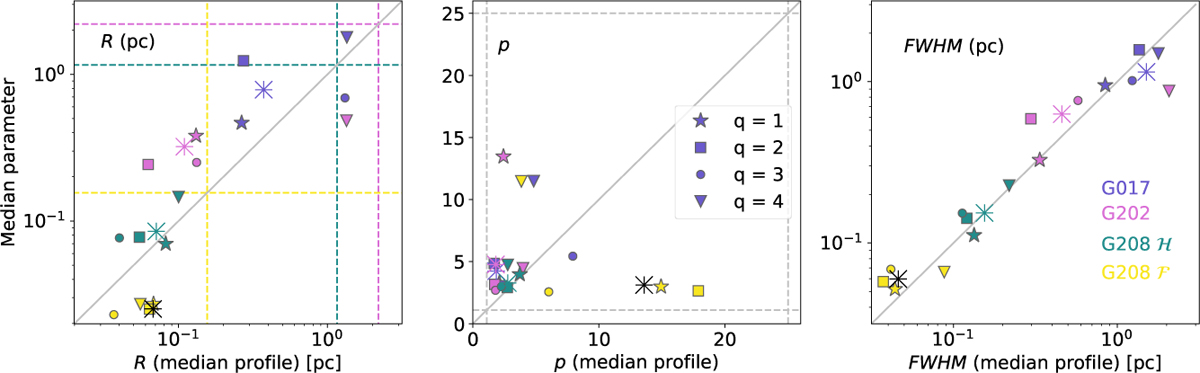
Fit to the median profile plotted against (y-axis) the median values calculated separately for each filament profile (x-axis). The gray solid line represents a relation of y = x. Quality flags are represented by a star, square, circle, and triangle, in order of decreasing quality. The fit to the entire field, regardless of quality flag, is shown by an asterisk. The dashed lines represent upper and lower bounds to the fits. In frame 1, the color of the line corresponds to the field.
Current usage metrics show cumulative count of Article Views (full-text article views including HTML views, PDF and ePub downloads, according to the available data) and Abstracts Views on Vision4Press platform.
Data correspond to usage on the plateform after 2015. The current usage metrics is available 48-96 hours after online publication and is updated daily on week days.
Initial download of the metrics may take a while.