Open Access
Fig. 14
Download original image
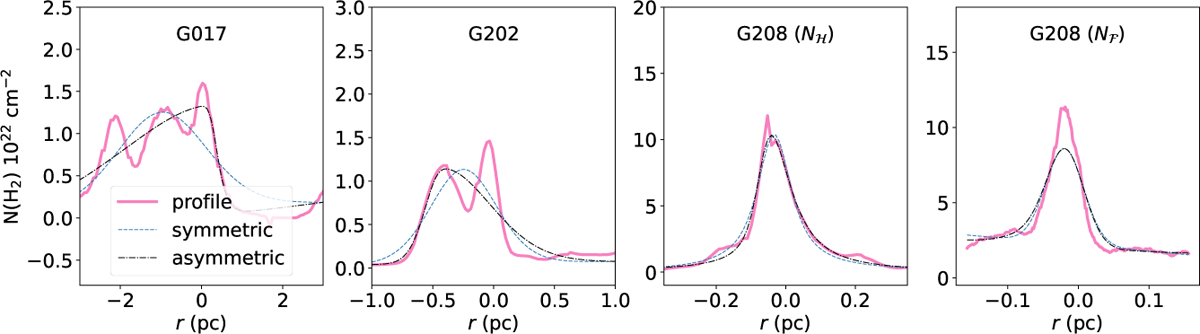
Profiles of the q = 1 filament with the largest offset in each of the four fields. The pink solid line corresponds to the observed profile, the blue dotted line to the symmetric Plummer fit and the black dashed line to the asymmetric Plummer fit.
Current usage metrics show cumulative count of Article Views (full-text article views including HTML views, PDF and ePub downloads, according to the available data) and Abstracts Views on Vision4Press platform.
Data correspond to usage on the plateform after 2015. The current usage metrics is available 48-96 hours after online publication and is updated daily on week days.
Initial download of the metrics may take a while.