Fig. 13
Download original image
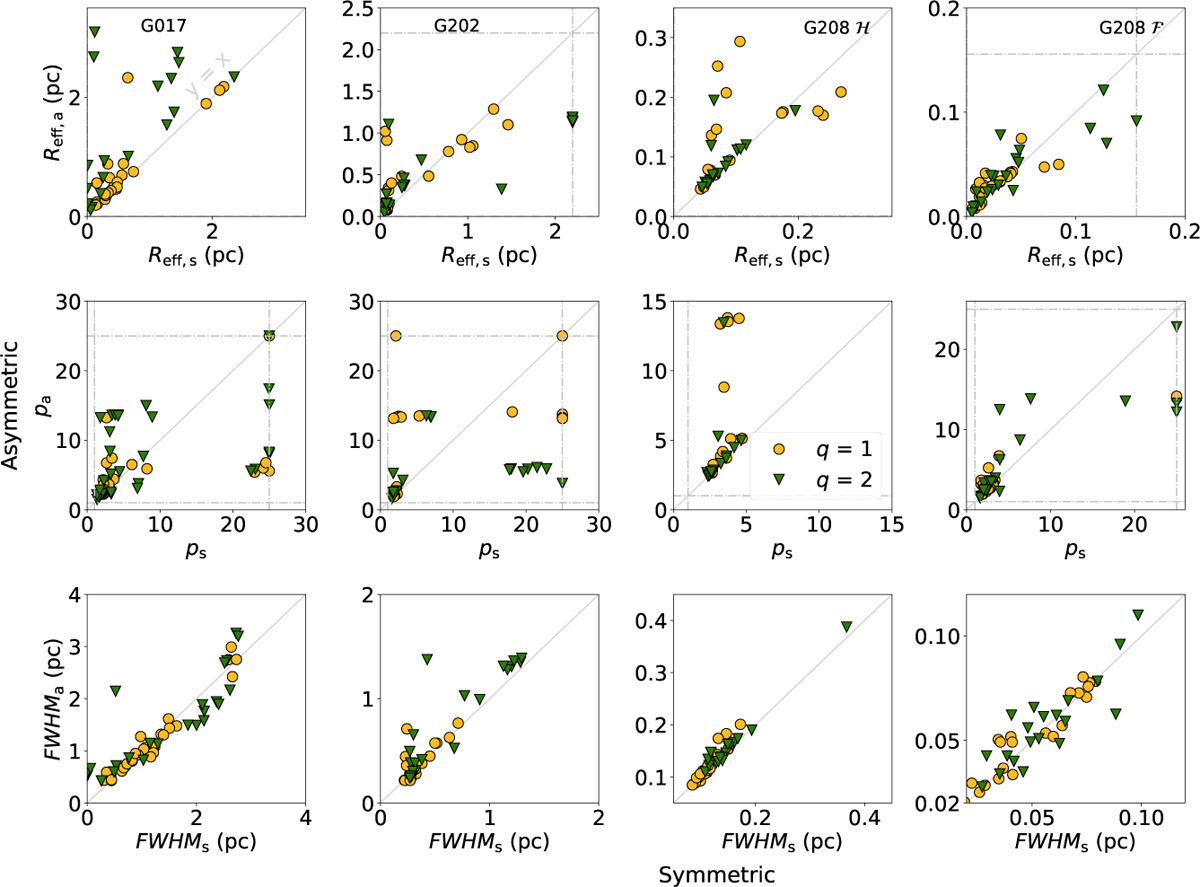
Comparison of symmetric and asymmetric Plummer fits for all fields. Rflat (top row), p (middle), and FWHM (bottom row) for symmetric (x-axes) and asymmetric (y-axes) fits. The q = 1 profiles are plotted with yellow circles and q = 2 profiles with green triangles. The gray solid line shows a 1:1 relation and the gray dashed lines highlight the allowed upper and lower limits of the Plummer parameters.
Current usage metrics show cumulative count of Article Views (full-text article views including HTML views, PDF and ePub downloads, according to the available data) and Abstracts Views on Vision4Press platform.
Data correspond to usage on the plateform after 2015. The current usage metrics is available 48-96 hours after online publication and is updated daily on week days.
Initial download of the metrics may take a while.