Fig. 12
Download original image
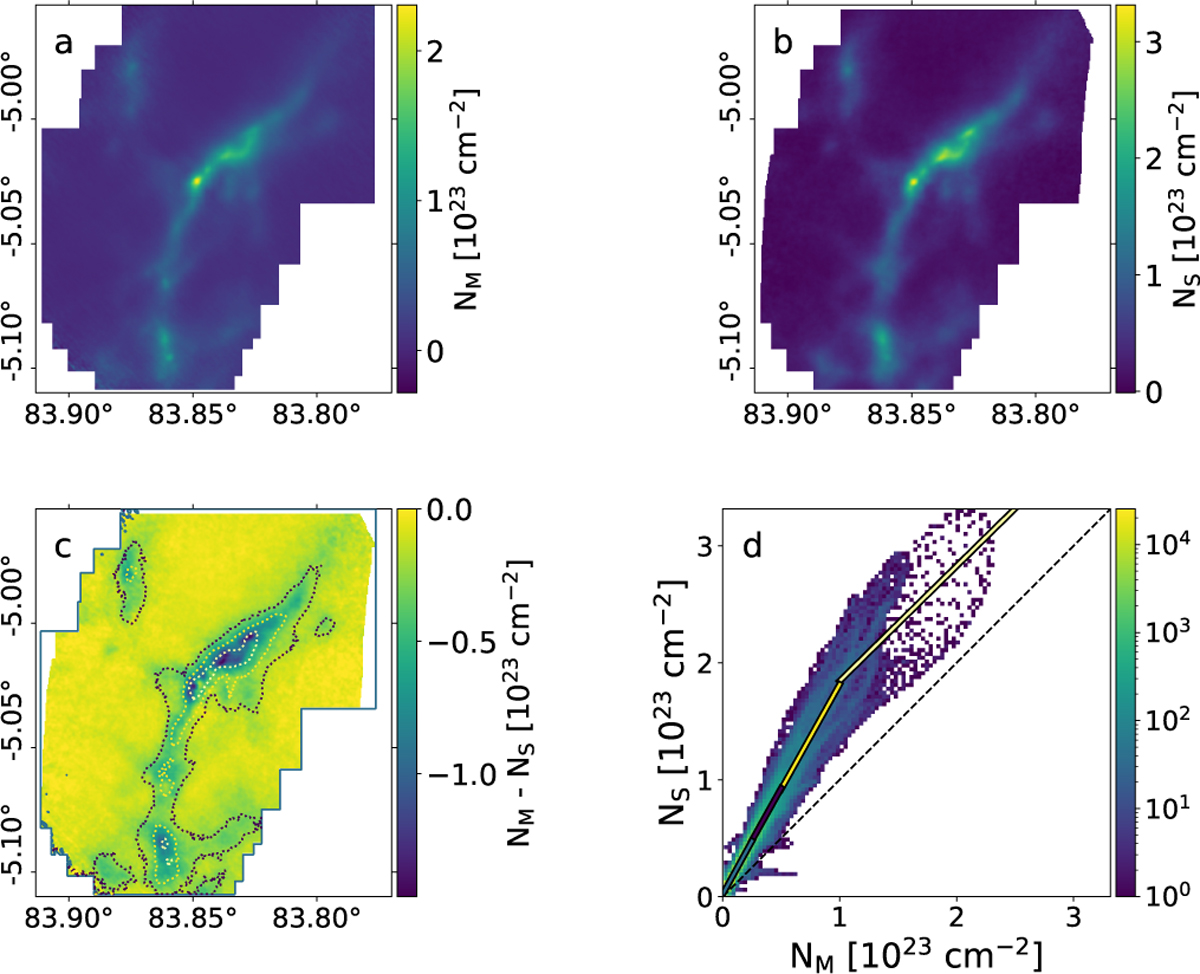
Comparison between column densities derived in this work (NM) and in Schuller et al. (2021) (NS) using a combinations of Herschel and ArTéMiS observations. Frame a: This work. Frame b: Schuller et al. (2021), APEX project 098.F-9304. Frame c: Difference between this work and that of Schuller. The contours correspond to NM = (0, 0.25, 0.5, 1.0) × 1023 cm−2 Frame d: Comparison plot between N(H2) values. The black dashed line represents a 1–1 relation, while the colored lines give the linear fits between NM and NS, with colors corresponding to the contours in frame c.
Current usage metrics show cumulative count of Article Views (full-text article views including HTML views, PDF and ePub downloads, according to the available data) and Abstracts Views on Vision4Press platform.
Data correspond to usage on the plateform after 2015. The current usage metrics is available 48-96 hours after online publication and is updated daily on week days.
Initial download of the metrics may take a while.