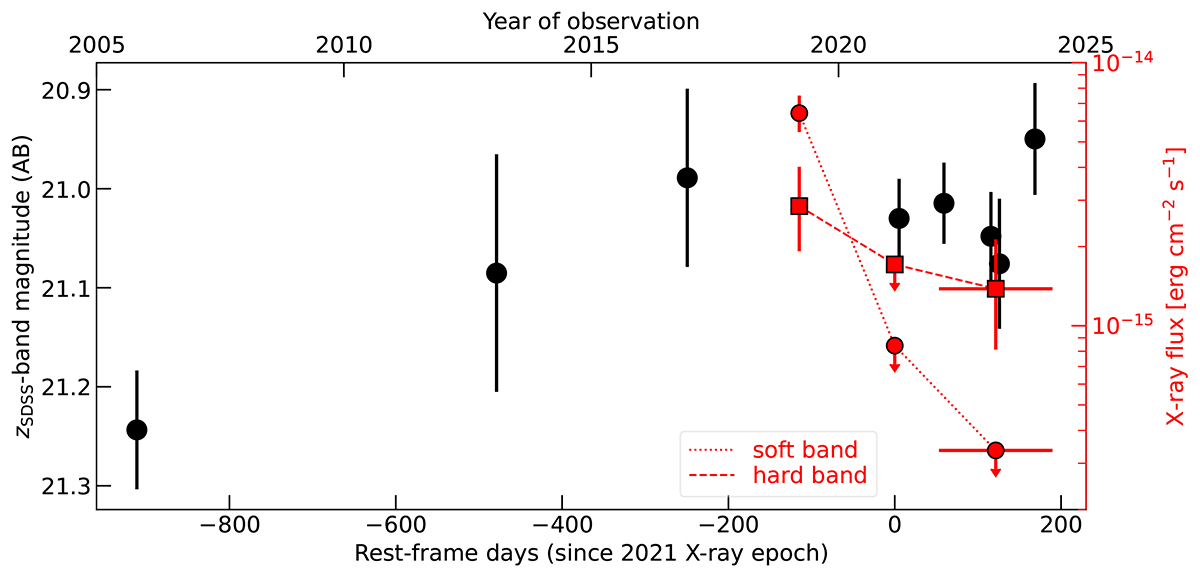
Fig. 2.
Download original image
X-ray light curve of J1641 as a function of observation time: red circles and squares are the observed soft- and hard-band fluxes, respectively. The most recent red points refer to the stacked Chandra observations taken in 2022, 2023, and 2024 and are plotted at the average observing date (Table 1), with horizontal error bars encompassing the times of the three stacked observations. The soft-band flux of J1641 dropped by a factor of > 20, while the QSO is still detected in the hard band with at most a modest dimming. Black points are the z-band magnitudes of J1641 (V22 and Table 2) and show no significant variation over the period covered by the X-ray observations.
Current usage metrics show cumulative count of Article Views (full-text article views including HTML views, PDF and ePub downloads, according to the available data) and Abstracts Views on Vision4Press platform.
Data correspond to usage on the plateform after 2015. The current usage metrics is available 48-96 hours after online publication and is updated daily on week days.
Initial download of the metrics may take a while.