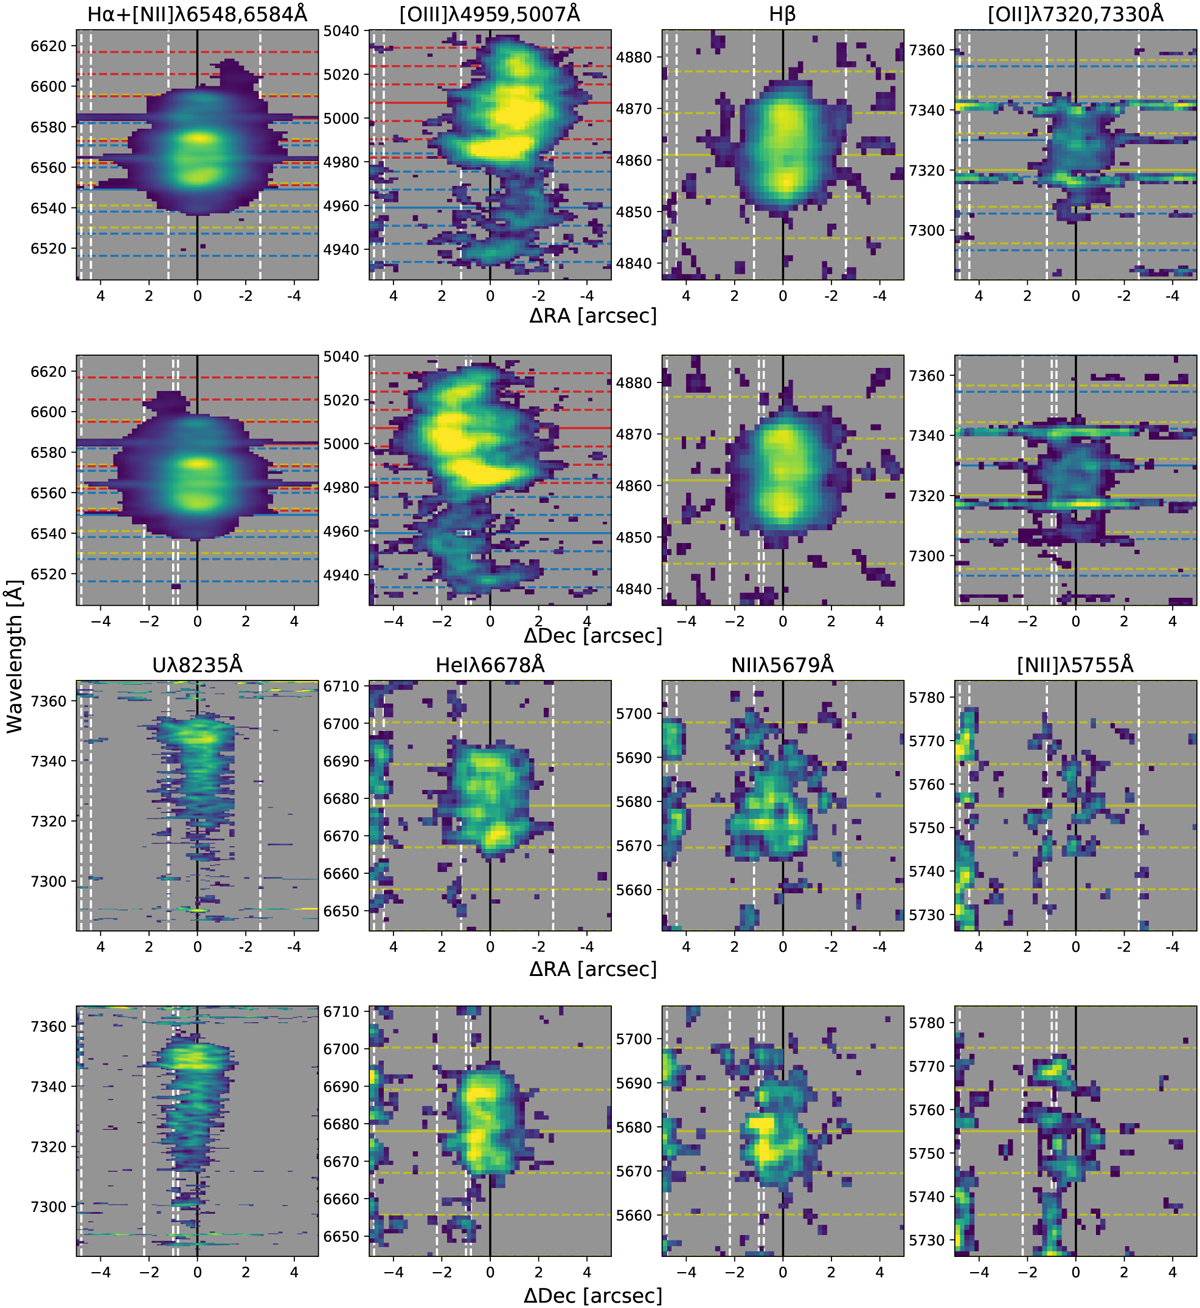
Fig. 6
Download original image
PV planes for RA and Dec showing the fluxes of Hα+[NII], [OII], Hβ, the U emission, [OII], NII, HeI, and [NII]. In each plane, the horizontal dashed lines indicate velocities in steps of ±500 km s−1 with respect to the rest line (solid line), while the positions of the stars near V1425 Aql are marked with vertical dashed white lines. In the RA planes east is to the left, while in the Dec planes north is to the right. To highlight the flux from the nova shell, the planes have been smoothed and the pixels with low fluxes have been discarded. In all cases, the fluxes are presented using a linear scale. All observed lines trace the inner shell, which appears as a compact, symmetric, and slow component (υexp ≲500 km s−1). The outer shell appears clearly in the [OIII] planes as an asymmetric component, but also in [NII] as a little horn in the red part of the Hα+[NII] planes.
Current usage metrics show cumulative count of Article Views (full-text article views including HTML views, PDF and ePub downloads, according to the available data) and Abstracts Views on Vision4Press platform.
Data correspond to usage on the plateform after 2015. The current usage metrics is available 48-96 hours after online publication and is updated daily on week days.
Initial download of the metrics may take a while.