Fig. 5
Download original image
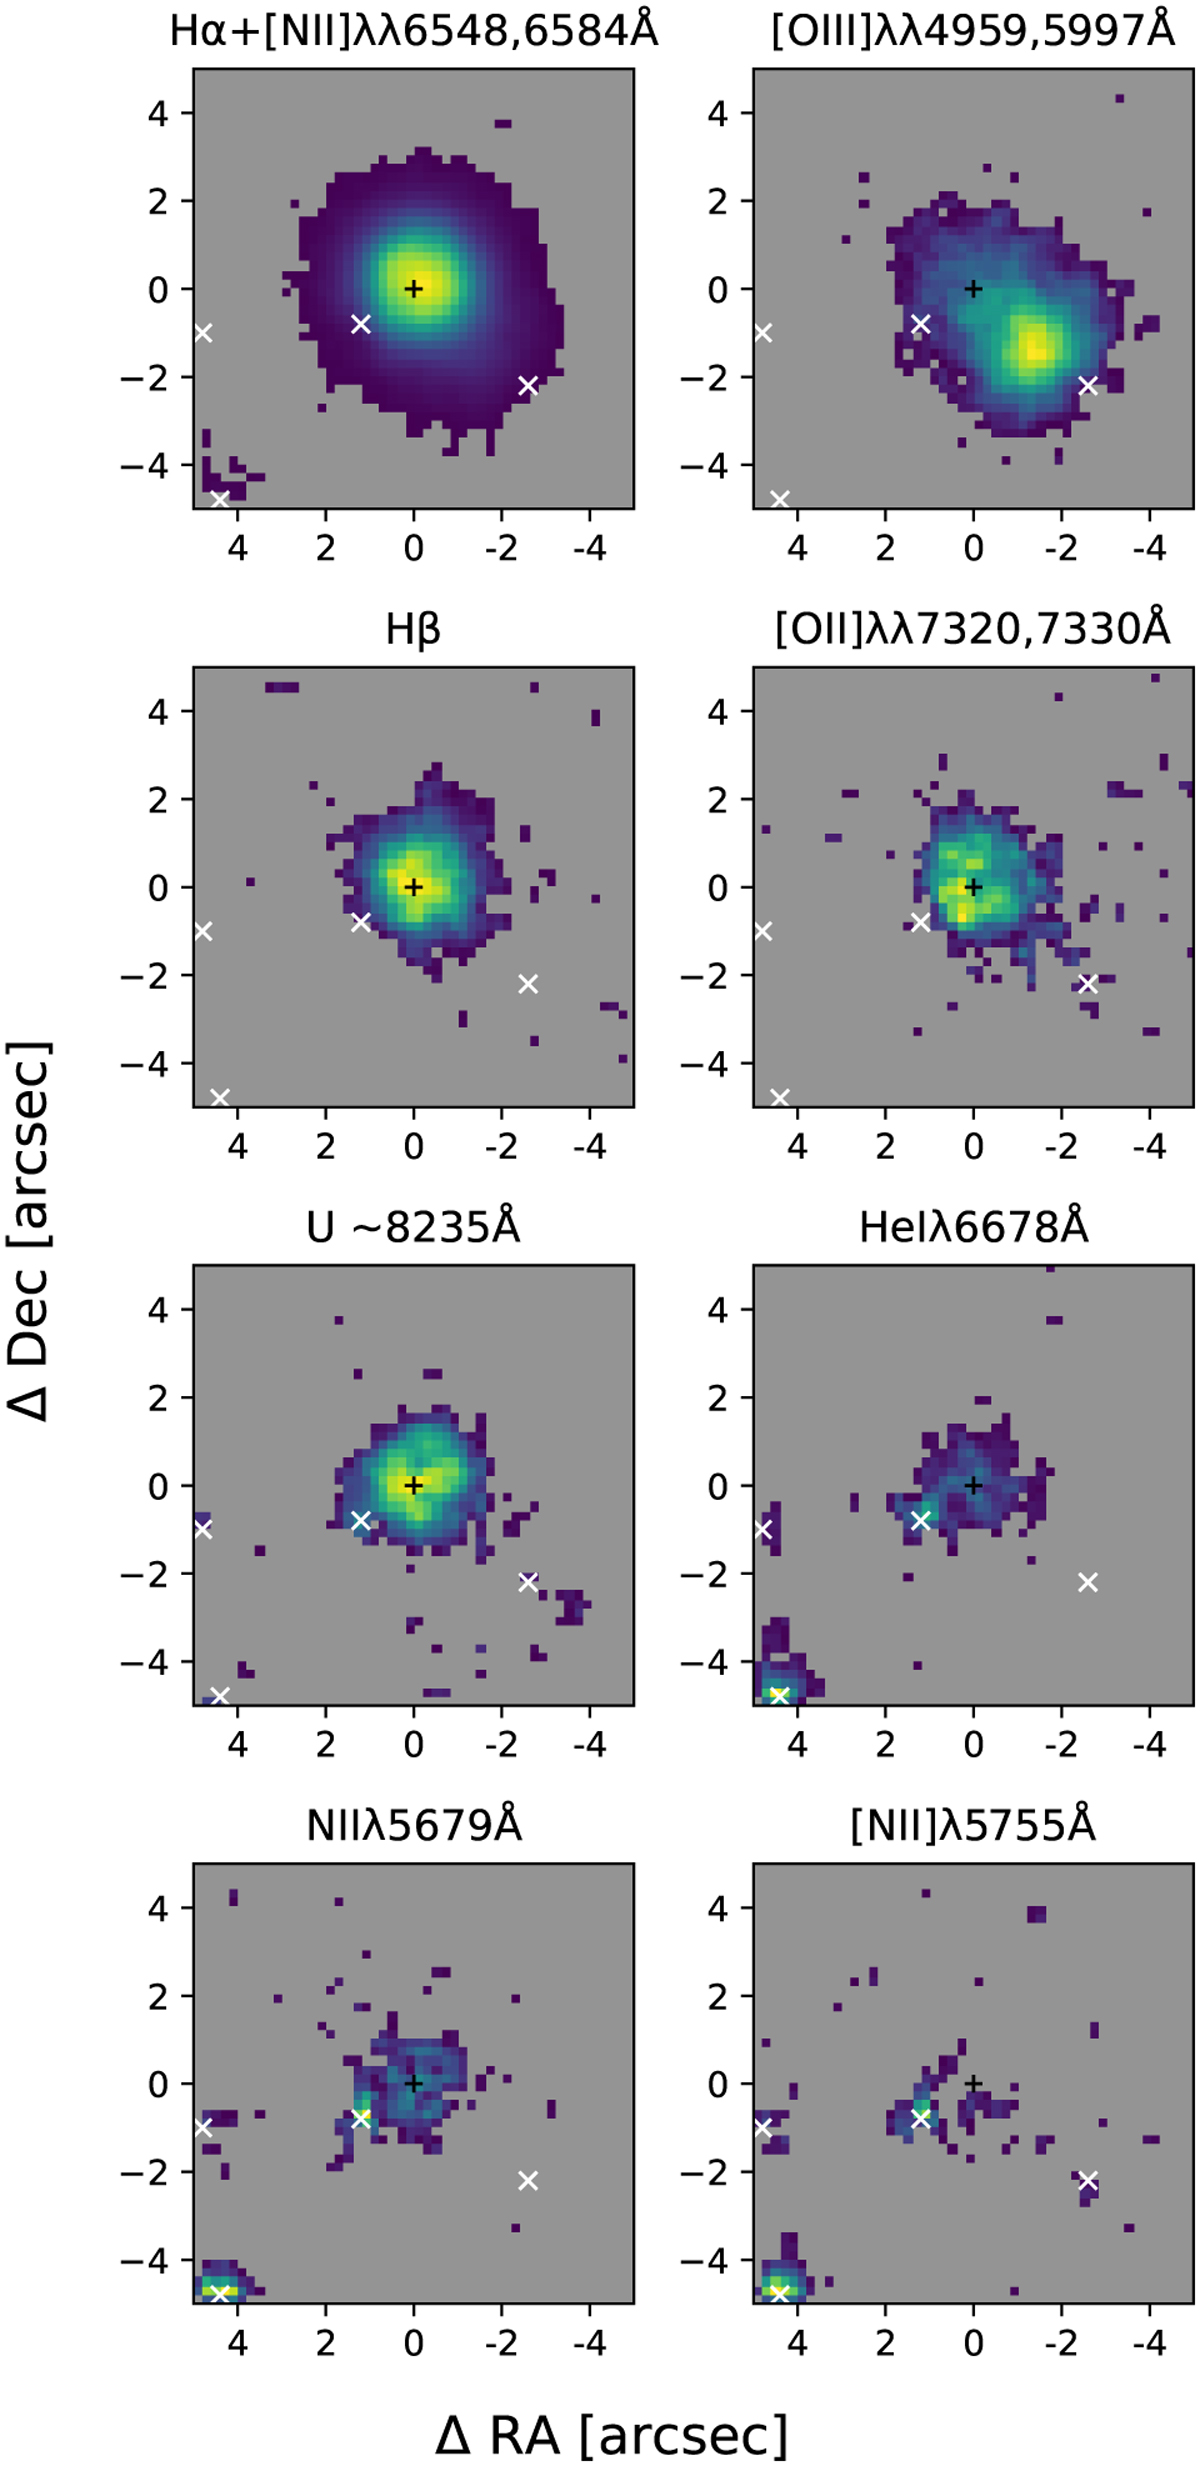
MUSE images of the strongest lines in the V1425 Aql nova shell. They were obtained by summing the flux within a certain spectral range after subtracting the continuum. They were smoothed using a Gaussian kernel, and the values below the background median value plus one sigma were masked. The position of the binary is marked with a black cross, and the white marks indicate the position of the nearby stars in the field. Most of the observed emission traces the inner shell, and the outer shell is observed only in [OIII], Hα+[NII], and [OII].
Current usage metrics show cumulative count of Article Views (full-text article views including HTML views, PDF and ePub downloads, according to the available data) and Abstracts Views on Vision4Press platform.
Data correspond to usage on the plateform after 2015. The current usage metrics is available 48-96 hours after online publication and is updated daily on week days.
Initial download of the metrics may take a while.