Fig. 4
Download original image
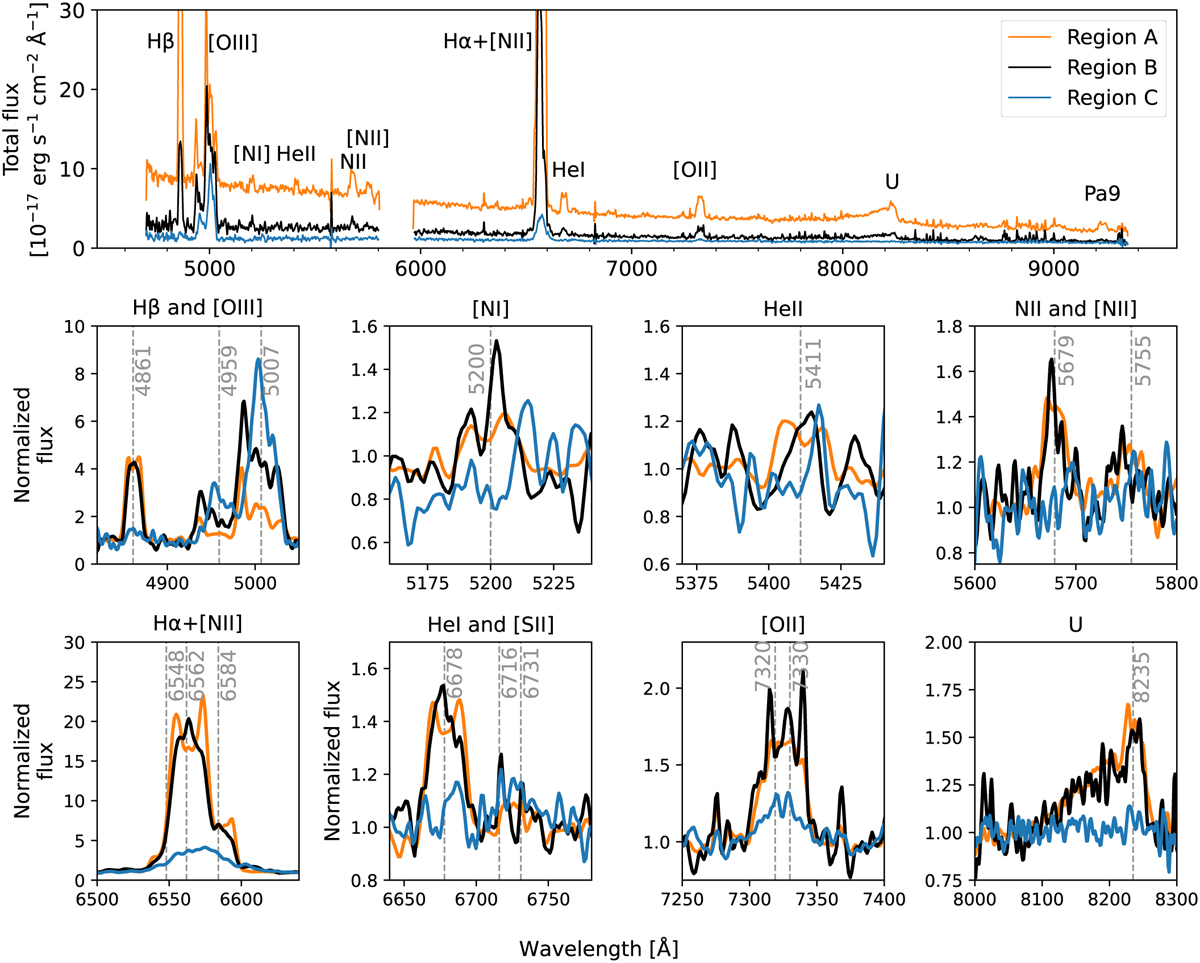
Extracted spectra of the three different regions defined: A (binary + inner shell), B (inner shell only), and C (outer shell). The top panel shows the extracted spectra to illustrate their differences along the whole MUSE wavelength coverage in terms of the continuum and emission lines. The bottom panels show a zoomed-in view of the differences between the three spectra for the different lines, including some weak lines that are not visible in the top panel spectra. All the bottom spectra have been normalised to the continuum for a better comparison.
Current usage metrics show cumulative count of Article Views (full-text article views including HTML views, PDF and ePub downloads, according to the available data) and Abstracts Views on Vision4Press platform.
Data correspond to usage on the plateform after 2015. The current usage metrics is available 48-96 hours after online publication and is updated daily on week days.
Initial download of the metrics may take a while.