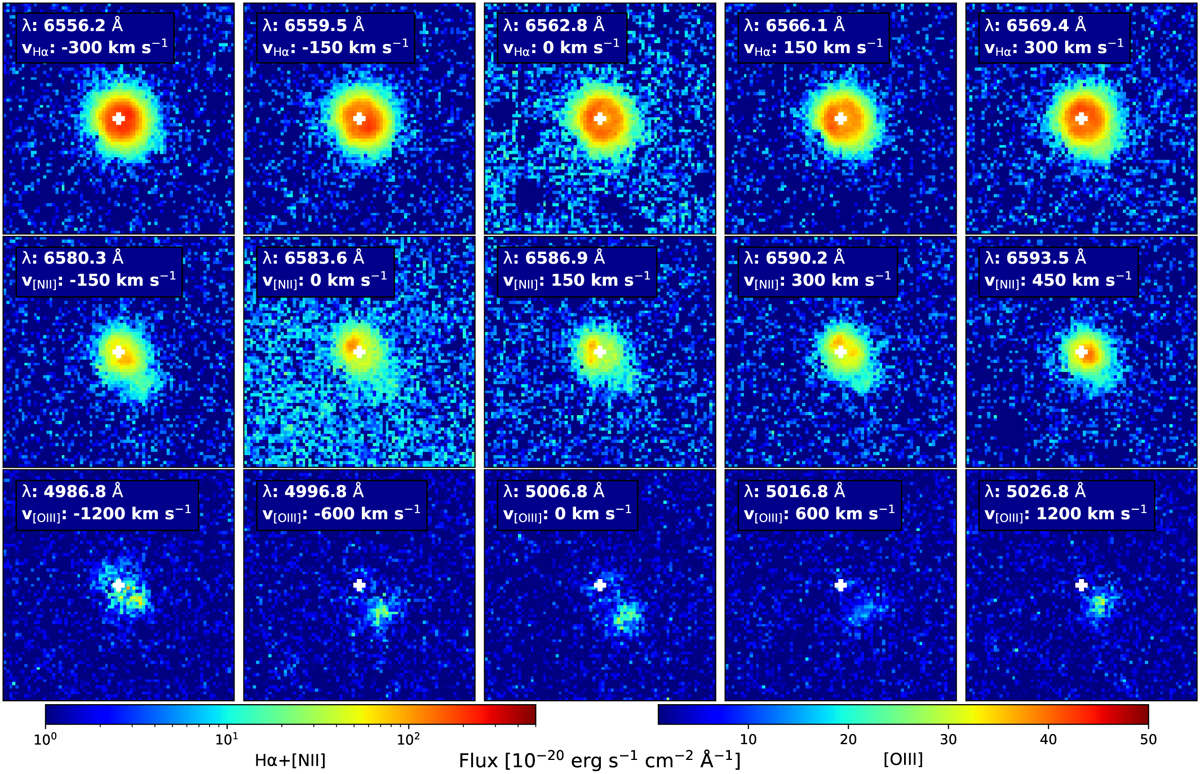
Fig. 3
Download original image
Channel maps of V1425 Aql for the lines of Hα (top row), [NII] λ 6584 Å (middle row), and [OIII] λ 5007 Å (bottom row). Each channel map shows a region of 15 × 15 arcsec2. In all cases, the fluxes are presented in linear scales, with their ranges defined in the colour bars and the position of the binary marked with a white cross. For each line, the velocities were chosen to illustrate the behaviour of the different lines. The behaviour of the strongest lines in the nova shell as a function of their velocity illustrates the structures hidden within the inner shell, previously unnoticed in T23.
Current usage metrics show cumulative count of Article Views (full-text article views including HTML views, PDF and ePub downloads, according to the available data) and Abstracts Views on Vision4Press platform.
Data correspond to usage on the plateform after 2015. The current usage metrics is available 48-96 hours after online publication and is updated daily on week days.
Initial download of the metrics may take a while.