Fig. 2
Download original image
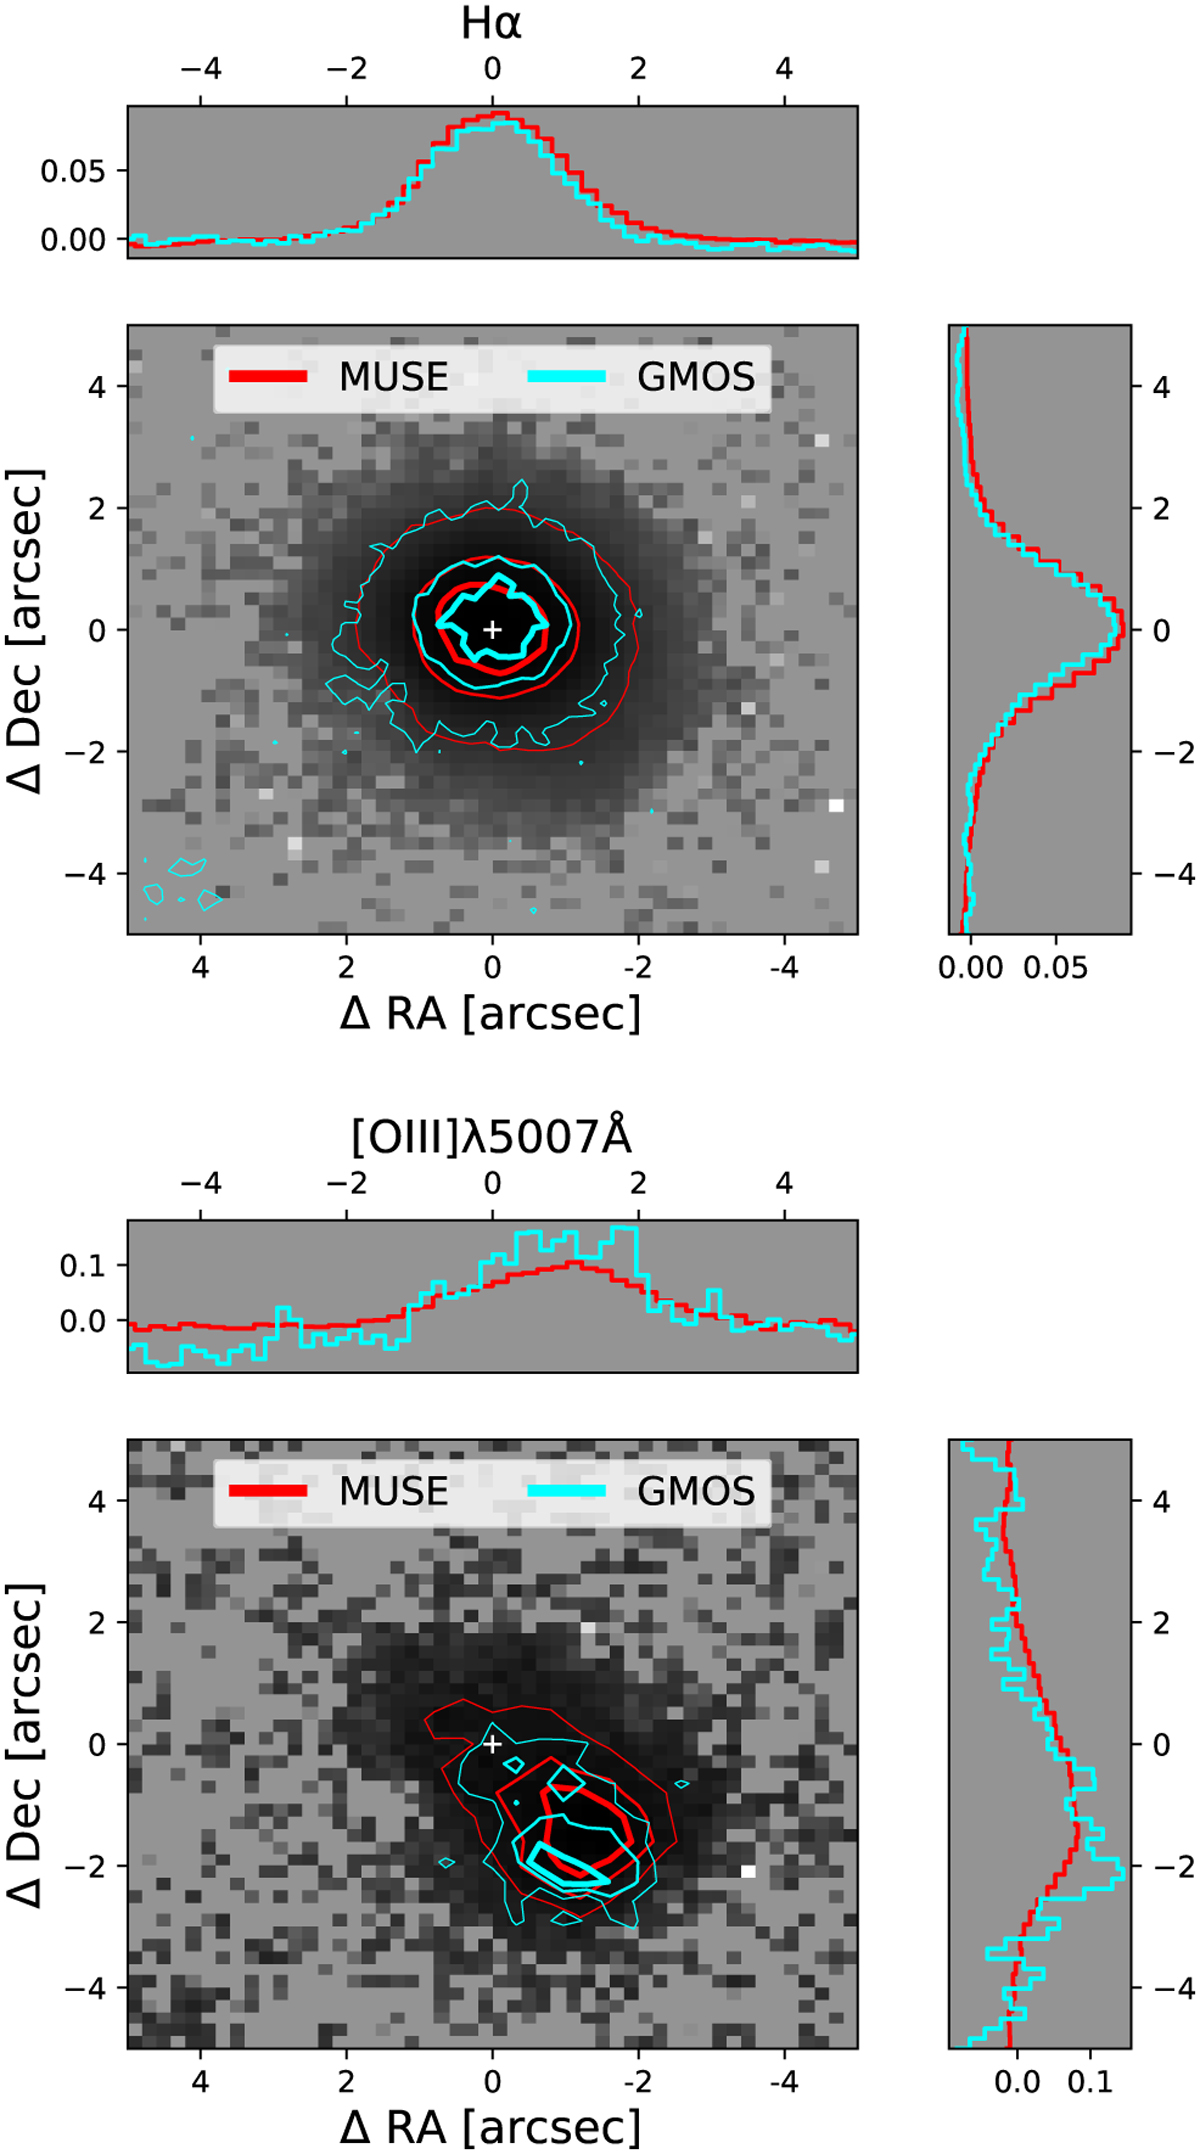
Comparison between the GMOS NB images presented in T23 and MUSE data for Hα (top) and [OIII] λ 5007 Å (bottom). The MUSE images (grey background) were obtained by mimicking the bandpass used in the GMOS images. The contour levels indicate the same normalised fluxes for MUSE (red) and GMOS (cyan), and the white cross marks the position of the binary. The contours presented in Hα indicate no major differences between GMOS and MUSE, while [OIII] shows differences in the location of the brightest region within the outer shell, although they can be attributed to the noise in the GMOS data.
Current usage metrics show cumulative count of Article Views (full-text article views including HTML views, PDF and ePub downloads, according to the available data) and Abstracts Views on Vision4Press platform.
Data correspond to usage on the plateform after 2015. The current usage metrics is available 48-96 hours after online publication and is updated daily on week days.
Initial download of the metrics may take a while.