Fig. 7.
Download original image
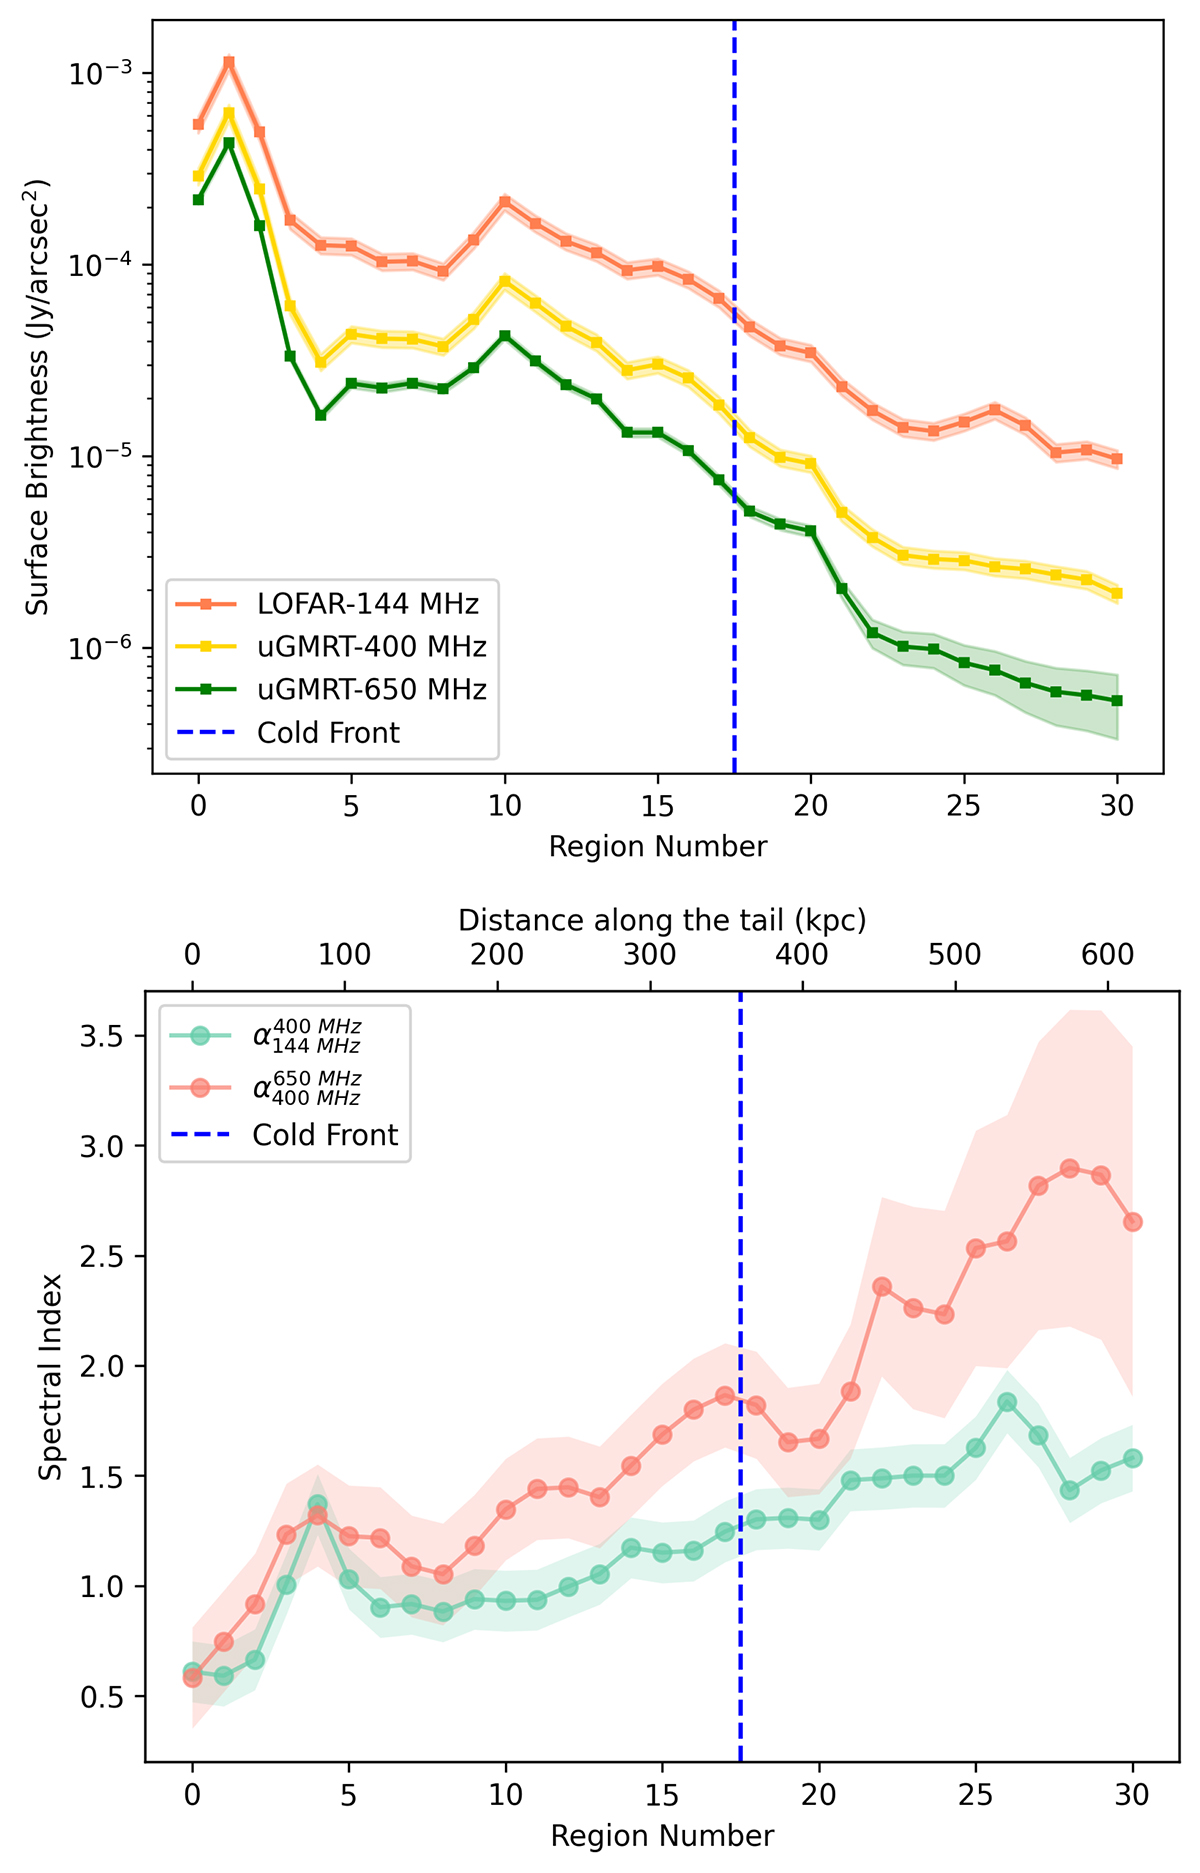
Surface brightness and spectral index profiles for the head-tail radio galaxy. Upper panel: Surface brightness trends along the head-tail measured from low-resolution images of the LOFAR at 144 MHz, followed by the uGMRT at 400 MHz, and the uGMRT at 650 MHz. Bottom panel: Spectral index profiles of low-resolution images of low and high frequency, over region numbers and projected distance along the tail in kiloparsecs. Distances in kiloparsecs were calculated, starting from region 0. The flux density for both plots was extracted from circular regions, as is depicted in Fig. 6. The vertical dashed blue line in both plots denotes the location of the arc-shaped cold front, where the tail ‘breaks’, as can be seen in Fig. 1.
Current usage metrics show cumulative count of Article Views (full-text article views including HTML views, PDF and ePub downloads, according to the available data) and Abstracts Views on Vision4Press platform.
Data correspond to usage on the plateform after 2015. The current usage metrics is available 48-96 hours after online publication and is updated daily on week days.
Initial download of the metrics may take a while.