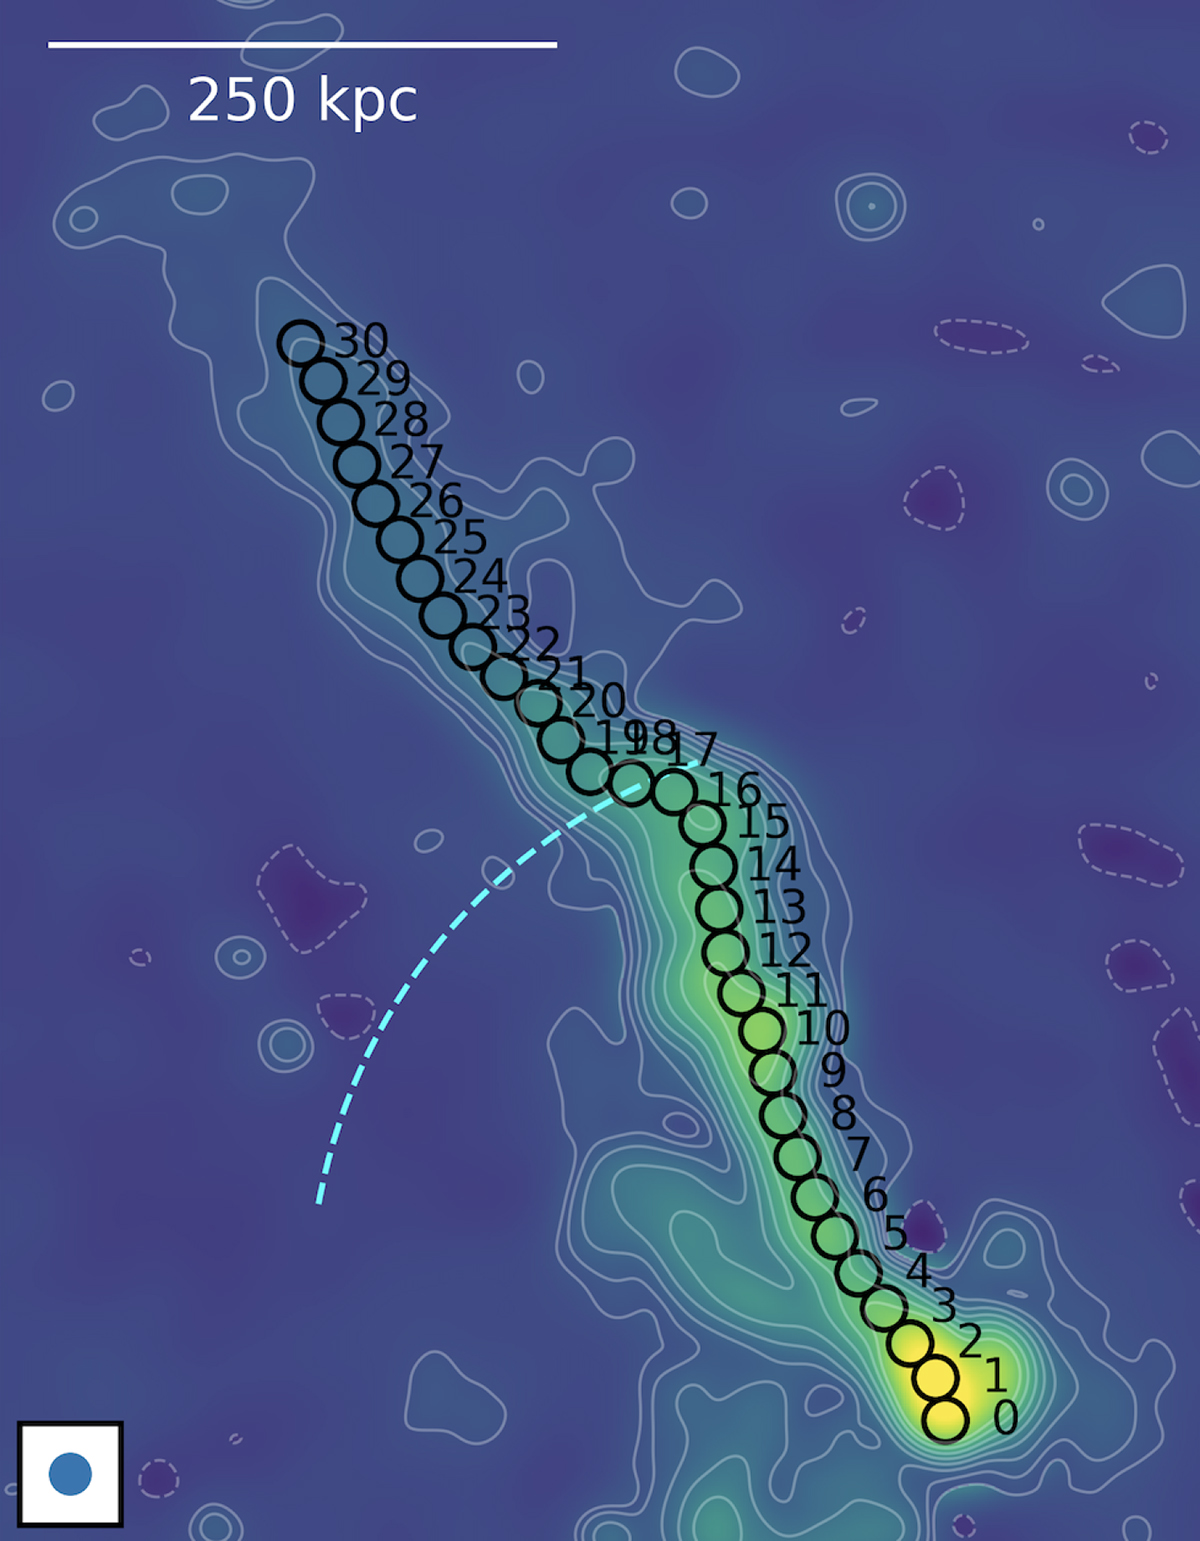
Fig. 6.
Download original image
Circular beam-sized regions with 15″ diameter drawn based on low-resolution images, using a 3σ emission threshold to identify the outermost region. They start from 0, marking the head of the tail, and extend up to 30, covering the entire length of the tail. These regions are overlaid in a uGMRT band 3 low-resolution image, with the arc-shaped cold front shown with a dashed blue line. The beam is shown in the bottom left corner, together with the scale bar in the top left corner.
Current usage metrics show cumulative count of Article Views (full-text article views including HTML views, PDF and ePub downloads, according to the available data) and Abstracts Views on Vision4Press platform.
Data correspond to usage on the plateform after 2015. The current usage metrics is available 48-96 hours after online publication and is updated daily on week days.
Initial download of the metrics may take a while.