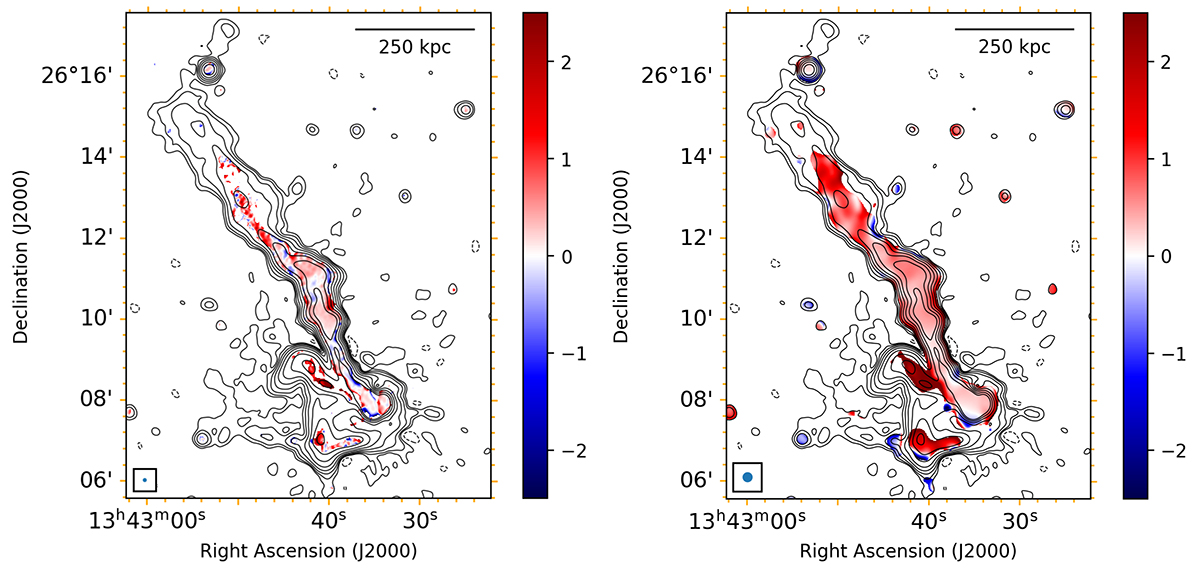
Fig. 5.
Download original image
Spectral curvature maps of the central region of Abell 1775. Left: Spectral curvature map of high-resolution radio images (6″ × 6″). Right: Spectral curvature map of low-resolution radio images (15″ × 15″). Both maps are three-frequency SC maps between 144 MHz and 650 MHz. Contour levels are drawn at [ − 1, 1, 2, 4, 8, 16...] × 3σrms of the LOFAR image at 15″ resolution. The diverging colour bar shows the SC from −2 to 2, where the white colour is when SC = 0.
Current usage metrics show cumulative count of Article Views (full-text article views including HTML views, PDF and ePub downloads, according to the available data) and Abstracts Views on Vision4Press platform.
Data correspond to usage on the plateform after 2015. The current usage metrics is available 48-96 hours after online publication and is updated daily on week days.
Initial download of the metrics may take a while.