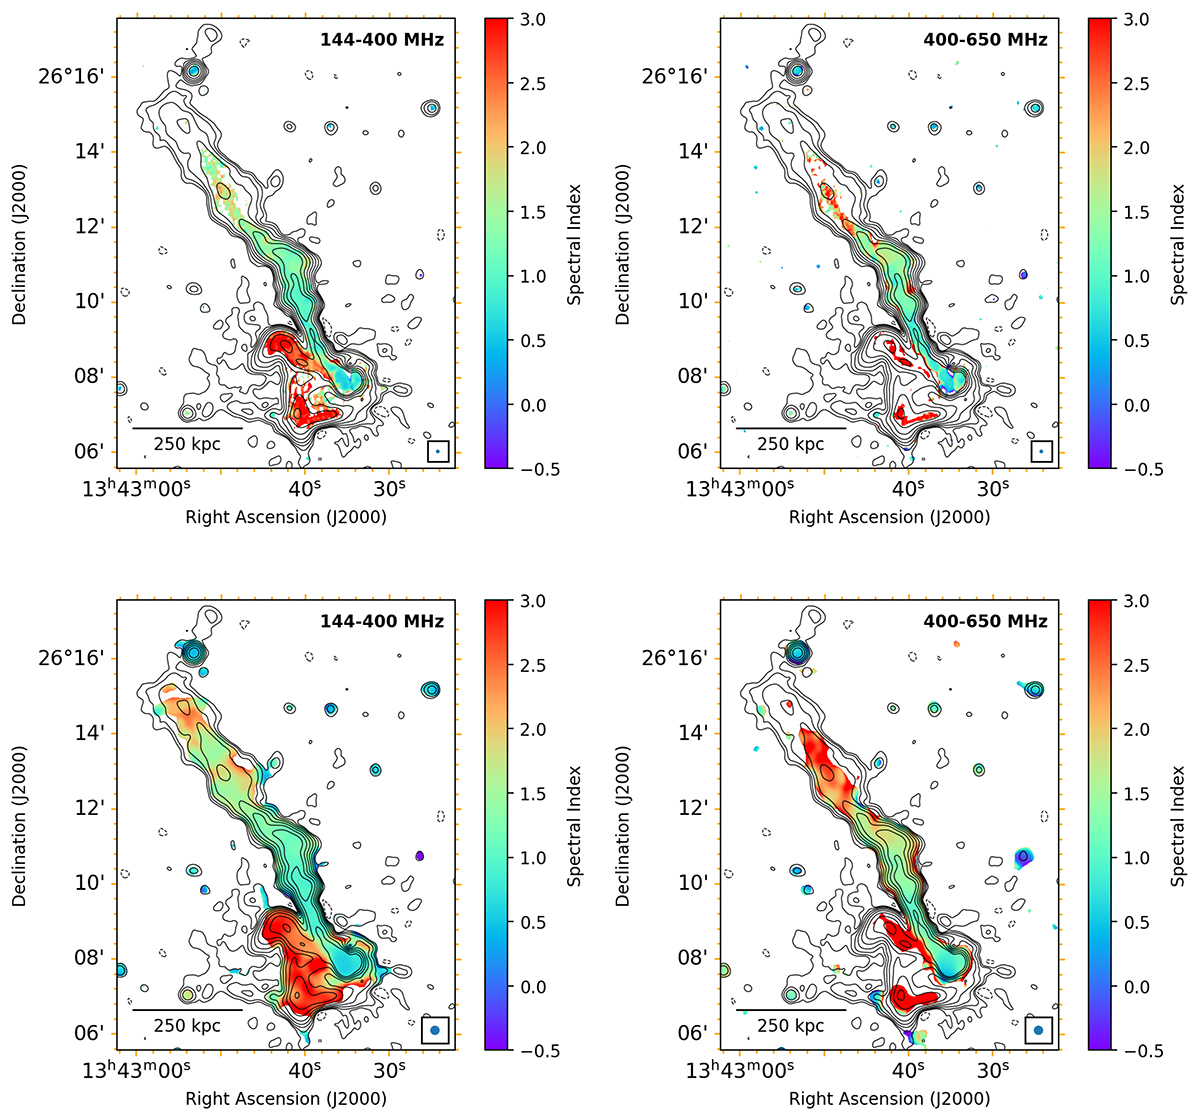
Fig. 4.
Download original image
Spectral index maps of the central region of Abell 1775. Upper panel: Spectral index maps of 6″ × 6″ resolution radio images. Left: Low-frequency spectral index map between LOFAR and uGMRT band 3. Right: High-frequency map between uGMRT band 3 and 4. Bottom panel: Spectral index maps at 15″ × 15″ resolution for both low (on the left) and high frequency (on the right). All images are overlaid with LOFAR contours of 15″ resolution. The beam size and the scale bar are indicated in all images.
Current usage metrics show cumulative count of Article Views (full-text article views including HTML views, PDF and ePub downloads, according to the available data) and Abstracts Views on Vision4Press platform.
Data correspond to usage on the plateform after 2015. The current usage metrics is available 48-96 hours after online publication and is updated daily on week days.
Initial download of the metrics may take a while.